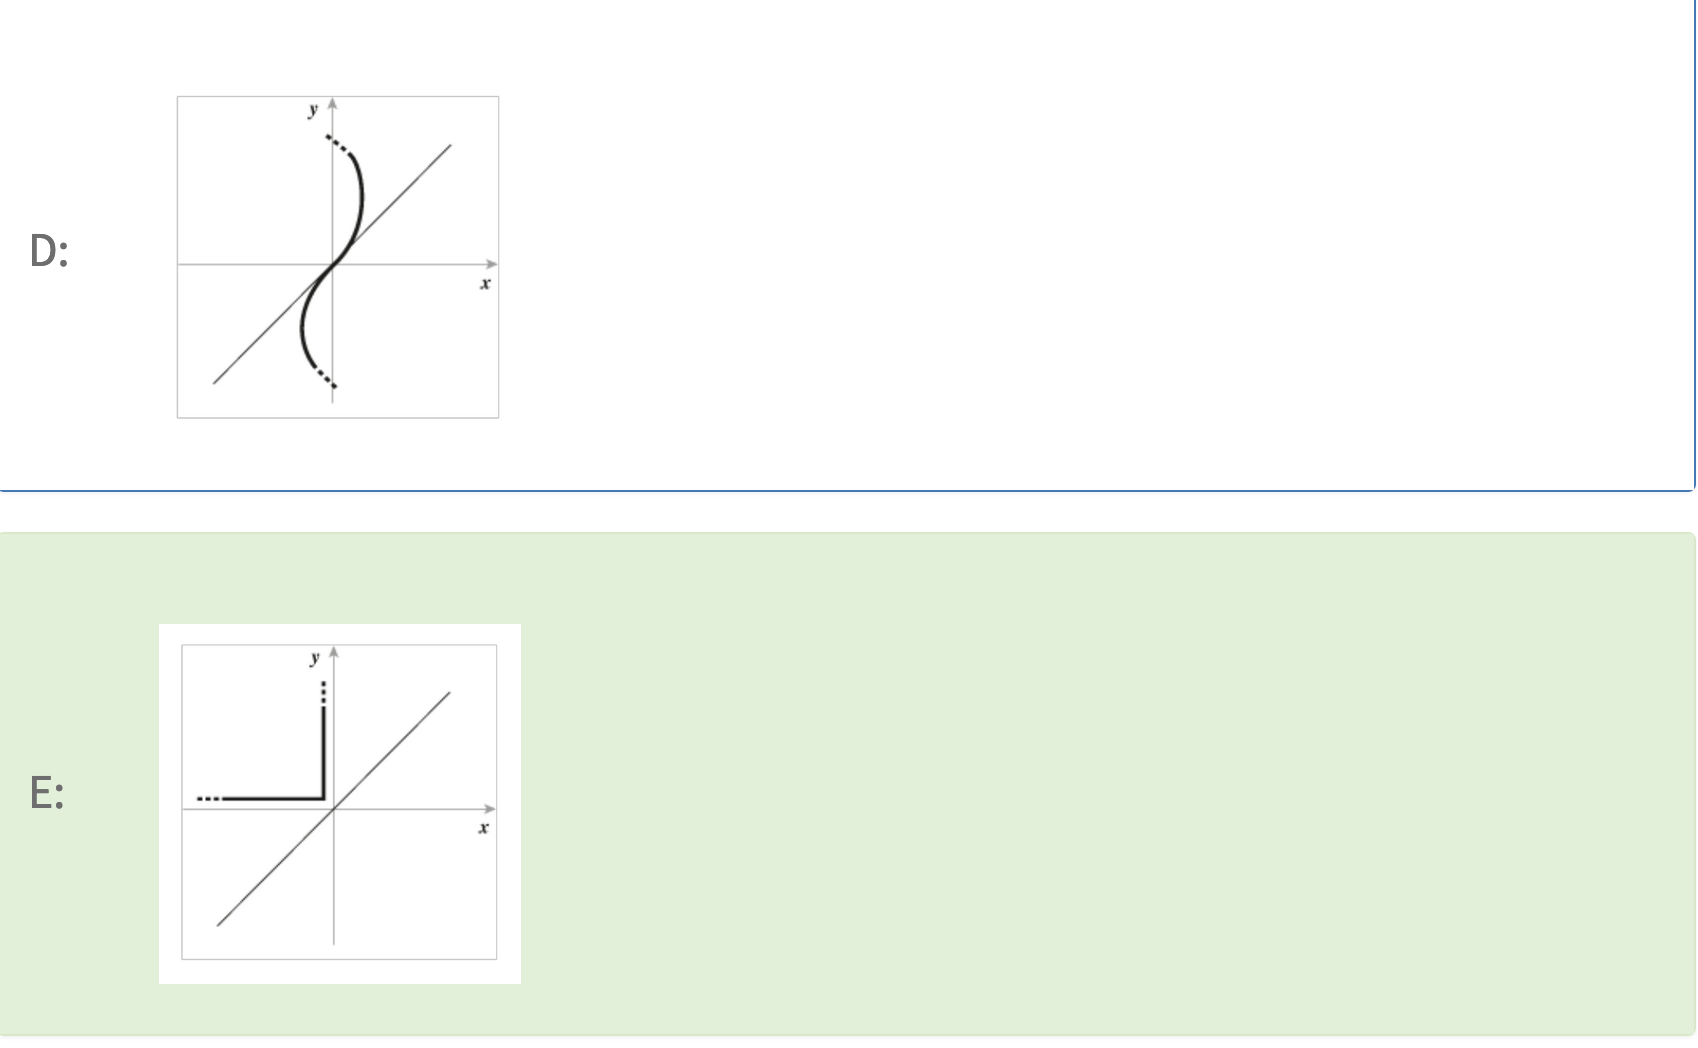
What do the graphs D and E represent?

Understand the Problem
The question involves two graphs labeled D and E, and it likely asks to analyze or compare them, possibly identifying types of functions or characteristics. The graphs represent different functions or behaviors, and the task may include classifying them or finding relationships between them.
Answer
Graph D is a logistic function; Graph E is an absolute value function.
Graph D represents a logistic function, often used in modeling populations that grow rapidly and then stabilize. Graph E represents an absolute value function, indicating a sharp turn point.
Answer for screen readers
Graph D represents a logistic function, often used in modeling populations that grow rapidly and then stabilize. Graph E represents an absolute value function, indicating a sharp turn point.
More Information
The logistic function is commonly used in biology for modeling population dynamics. Absolute value functions are utilized in various contexts such as measuring distance from zero.
Tips
A common mistake is to confuse the logistic curve with a purely exponential one; logistic growth stabilizes after reaching a carrying capacity.
AI-generated content may contain errors. Please verify critical information