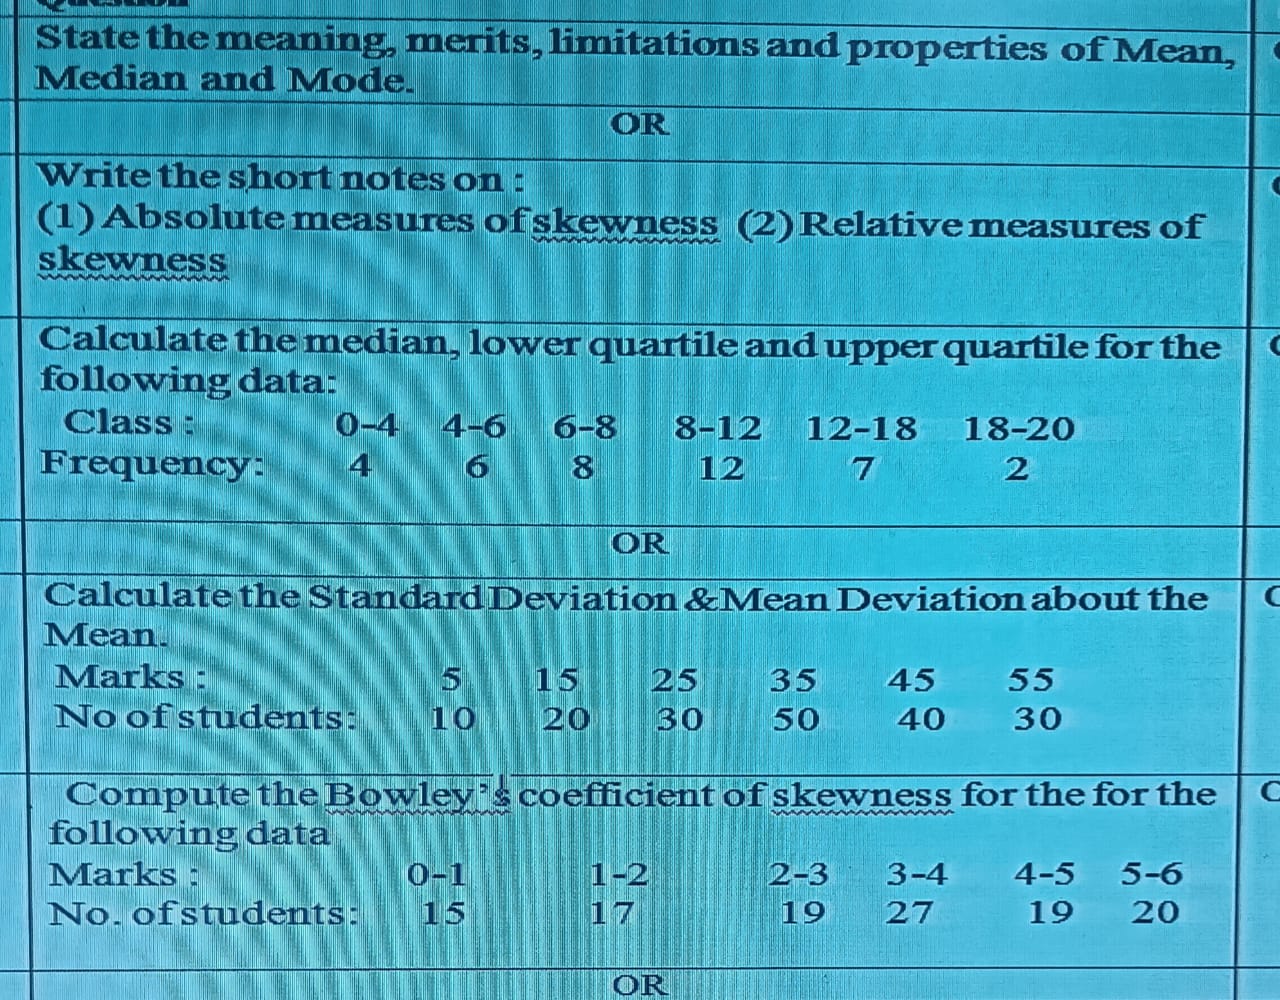
State the meaning, merits, limitations and properties of Mean, Median and Mode. Write short notes on: (1) Absolute measures of skewness (2) Relative measures of skewness. Calculate... State the meaning, merits, limitations and properties of Mean, Median and Mode. Write short notes on: (1) Absolute measures of skewness (2) Relative measures of skewness. Calculate the median, lower quartile, and upper quartile for the following data: Class: 0-4, 4-6, 6-8, 8-12, 12-18, 18-20; Frequency: 4, 6, 8, 12, 7, 2. Calculate the Standard Deviation & Mean Deviation about the Mean. Marks: 5, 15, 25, 35, 45, 55; No of students: 10, 20, 30, 50, 40, 30. Compute the Bowley's coefficient of skewness for the following data: Marks: 0-1, 1-2, 2-3, 3-4, 4-5, 5-6; No of students: 15, 17, 19, 27, 19, 20.

Understand the Problem
The question is asking for explanations and calculations related to statistical measures. It covers the definitions and characteristics of mean, median, and mode, as well as specific statistical calculations such as the median, quartiles, standard deviation, and skewness based on provided data.
Answer
Median: $8.5$, Q1: $5.9375$, Q3: $11.3572$
Answer for screen readers
- Median: $8.5$
- Lower Quartile (Q1): $5.9375$
- Upper Quartile (Q3): $11.3572$
Steps to Solve
-
Organize the Data The data is provided in classes and frequencies. For calculating the median and quartiles, we first create a cumulative frequency table.
Class Frequency Cumulative Frequency 0-4 4 4 4-6 6 10 6-8 8 18 8-12 12 30 12-18 7 37 18-20 2 39 -
Calculate the Total Frequency The total frequency (N) is the sum of all frequencies. $$ N = 4 + 6 + 8 + 12 + 7 + 2 = 39 $$
-
Find the Median To find the median, identify the median class. Since $N = 39$, the median will be at position $19.5$. The median class is the one where the cumulative frequency reaches 19.
- Median class: 8-12 (cumulative frequency 30)
- Median calculated by: $$ \text{Median} = L + \left(\frac{N/2 - CF}{f}\right) \times h $$ Where:
- $L = 8$ (lower boundary of median class)
- $CF = 18$ (cumulative frequency of the class before median class)
- $f = 12$ (frequency of median class)
- $h = 4$ (class width)
Calculate median: $$ \text{Median} = 8 + \left(\frac{19.5 - 18}{12}\right) \times 4 $$ $$ \text{Median} = 8 + \left(\frac{1.5}{12}\right) \times 4 $$ $$ \text{Median} = 8 + 0.5 = 8.5 $$
-
Calculate Lower and Upper Quartiles (Q1 and Q3)
-
For Q1 (lower quartile):
- Position: $N/4 = 9.75$, so the Q1 class is 6-8.
- Using a similar formula: $$ Q1 = L + \left(\frac{N/4 - CF}{f}\right) \times h $$ $$ Q1 = 6 + \left(\frac{9.75 - 10}{8}\right) \times 2 $$ $$ Q1 = 6 + \left(-0.03125\right) \times 2 $$ $$ Q1 = 6 - 0.0625 = 5.9375 $$
-
For Q3 (upper quartile):
- Position: $3N/4 = 29.25$, so the Q3 class is 12-18.
- Using a similar formula: $$ Q3 = 12 + \left(\frac{29.25 - 30}{7}\right) \times 6 $$ $$ Q3 = 12 + \left(-0.10714\right) \times 6 $$ $$ Q3 = 12 - 0.6428 = 11.3572 $$
-
-
Summarize Results
- Median: $8.5$
- Lower Quartile (Q1): $5.9375$
- Upper Quartile (Q3): $11.3572$
- Median: $8.5$
- Lower Quartile (Q1): $5.9375$
- Upper Quartile (Q3): $11.3572$
More Information
The calculations for the median and quartiles rely on understanding the cumulative frequency distribution, which helps locate the position of the median and quartiles within data grouped into classes.
Tips
- Misidentifying the median class due to incorrect cumulative frequency calculations.
- Forgetting to consider the class boundaries when applying the formulas for median and quartiles.
AI-generated content may contain errors. Please verify critical information