Pamela rode her bike at a constant rate of 0.1 kilometer per minute. Which table represents y, the number of kilometers Pamela rode her bike in x minutes?

Understand the Problem
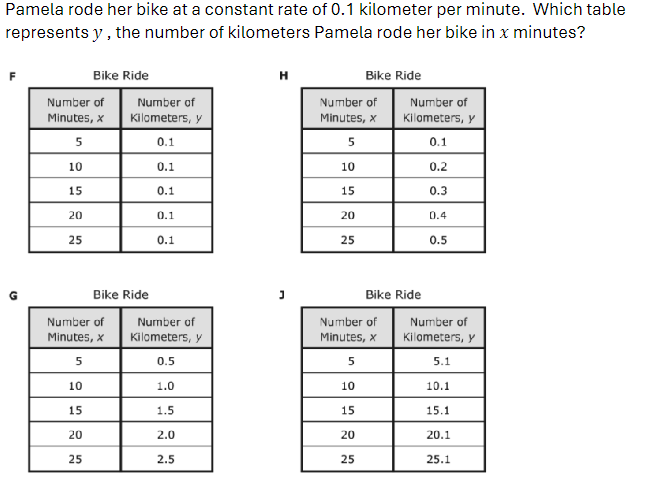
The question presents data in four tables and asks to identify which table accurately represents the relationship between the number of minutes Pamela rode her bike and the corresponding distance in kilometers, given that she rides at a constant rate of 0.1 kilometer per minute.
Answer
The correct table is **G**.
Answer for screen readers
The correct table is Table G.
Steps to Solve
- Identify the relationship between time and distance
Pamela rides at a rate of $0.1$ kilometers per minute. The total distance $y$ in kilometers for a given time $x$ in minutes can be calculated using the formula: $$ y = 0.1x $$
- Calculate expected distances
We will use the formula to calculate the expected distances for each number of minutes given in the tables.
-
For $x = 5$:
$$ y = 0.1 \times 5 = 0.5 $$ -
For $x = 10$:
$$ y = 0.1 \times 10 = 1.0 $$ -
For $x = 15$:
$$ y = 0.1 \times 15 = 1.5 $$ -
For $x = 20$:
$$ y = 0.1 \times 20 = 2.0 $$ -
For $x = 25$:
$$ y = 0.1 \times 25 = 2.5 $$
- Compare with the given tables
Now, we compare the calculated distances with the values in each table to find which correctly represents the relationship.
-
Table F
- $x = 5$, $y = 0.1$
- $x = 10$, $y = 0.1$
- $x = 15$, $y = 0.1$
- $x = 20$, $y = 0.1$
- $x = 25$, $y = 0.1$
(Incorrect values)
-
Table G
- $x = 5$, $y = 0.5$
- $x = 10$, $y = 1.0$
- $x = 15$, $y = 1.5$
- $x = 20$, $y = 2.0$
- $x = 25$, $y = 2.5$
(Correct values)
-
Table H
- $x = 5$, $y = 0.1$
- $x = 10$, $y = 0.2$
- $x = 15$, $y = 0.4$
- $x = 20$, $y = 0.5$
- $x = 25$, $y = 0.5$
(Incorrect values)
-
Table J
- $x = 5$, $y = 5.1$
- $x = 10$, $y = 15.1$
- $x = 15$, $y = 15.1$
- $x = 20$, $y = 20.1$
- $x = 25$, $y = 25.1$
(Incorrect values)
The correct table is Table G.
More Information
Table G accurately reflects the correct relationship between the number of minutes Pamela rode her bike and the distance in kilometers, as they match the linear equation derived from her riding speed.
Tips
- Ignoring the constant rate: Some might misinterpret the rate and calculate the distances incorrectly. Always remember to consistently apply the rate given.
- Misreading table values: Double-check the values presented in the tables to avoid selecting incorrect options.
AI-generated content may contain errors. Please verify critical information