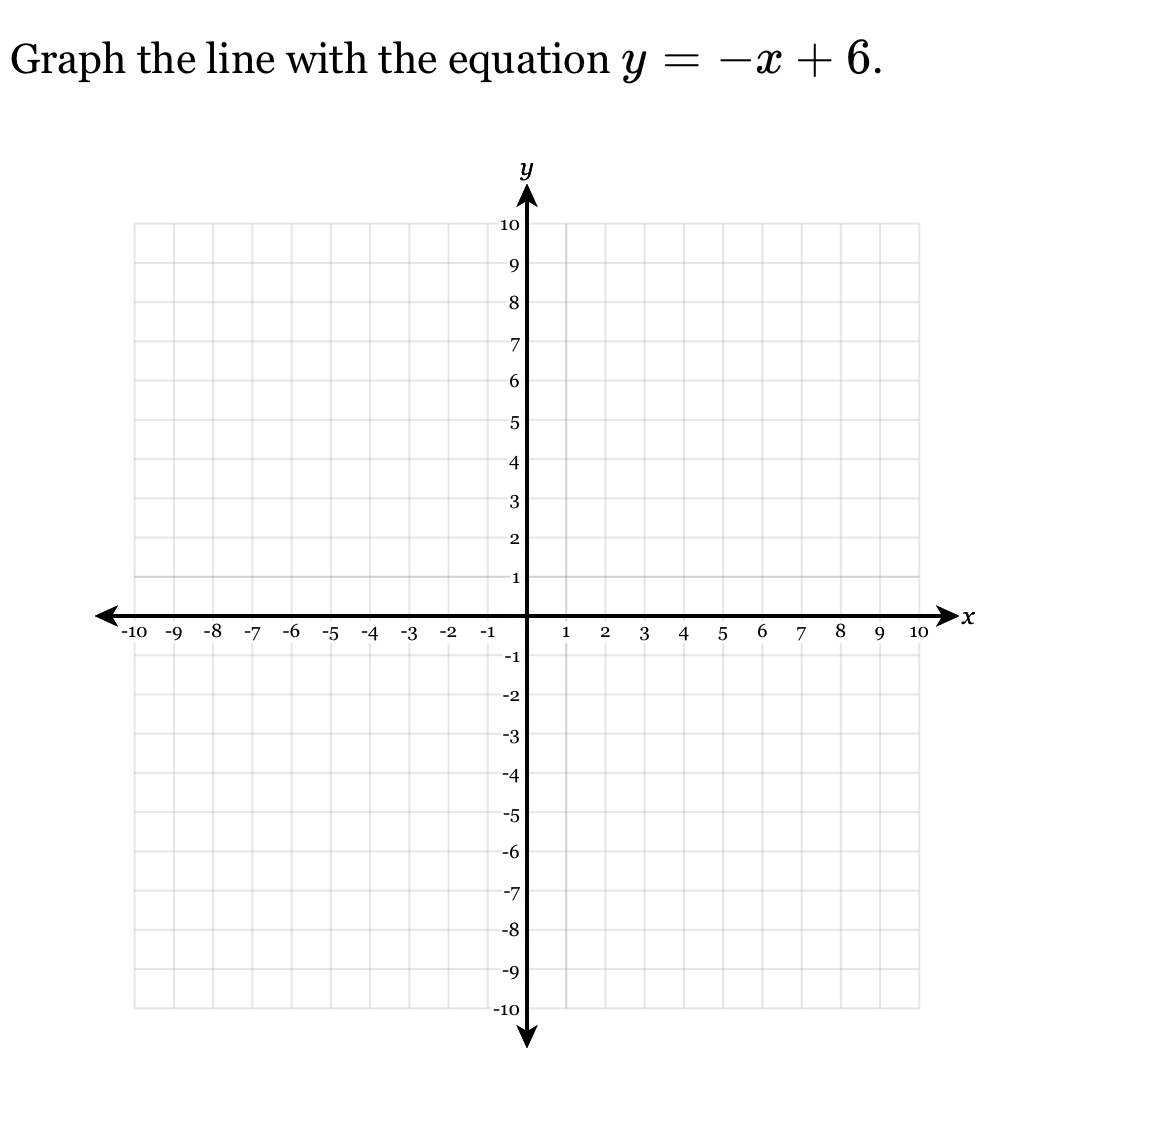
Graph the line with the equation y = -x + 6.

Understand the Problem
The question is asking for a graphical representation of the linear equation y = -x + 6. To solve it, we will identify key points on the graph by substituting values for x and calculating the corresponding y values.
Answer
The line for the equation is represented graphically as a straight line passing through the points (0, 6) and (6, 0).
Answer for screen readers
The graph of the line for the equation $y = -x + 6$ is a straight line that passes through the points (0, 6) and (6, 0).
Steps to Solve
- Identify the y-intercept
In the equation $y = -x + 6$, the y-intercept occurs when $x = 0$. Substituting $x = 0$ gives: $$ y = -0 + 6 = 6 $$ So, the point (0, 6) is on the graph.
- Identify another point using a specific x-value
Choose another value for $x$ to find another point. Let’s use $x = 6$: $$ y = -6 + 6 = 0 $$ Thus, the point (6, 0) is on the graph.
- Identify the slope
The slope of the line is included in the equation. The slope $m$ is -1. This means for every increase of 1 in $x$, $y$ decreases by 1.
- Plot the points on the graph
Plot the points (0, 6) and (6, 0) on the Cartesian plane.
- Draw the line
Draw a straight line through the two points. This represents the equation $y = -x + 6$.
The graph of the line for the equation $y = -x + 6$ is a straight line that passes through the points (0, 6) and (6, 0).
More Information
This linear equation represents a line with a negative slope, which means it goes down from left to right. The y-intercept is at 6, indicating where the line crosses the y-axis.
Tips
- Forgetting to plot the points accurately on the graph.
- Miscalculating the y-value for the selected x-value.
AI-generated content may contain errors. Please verify critical information