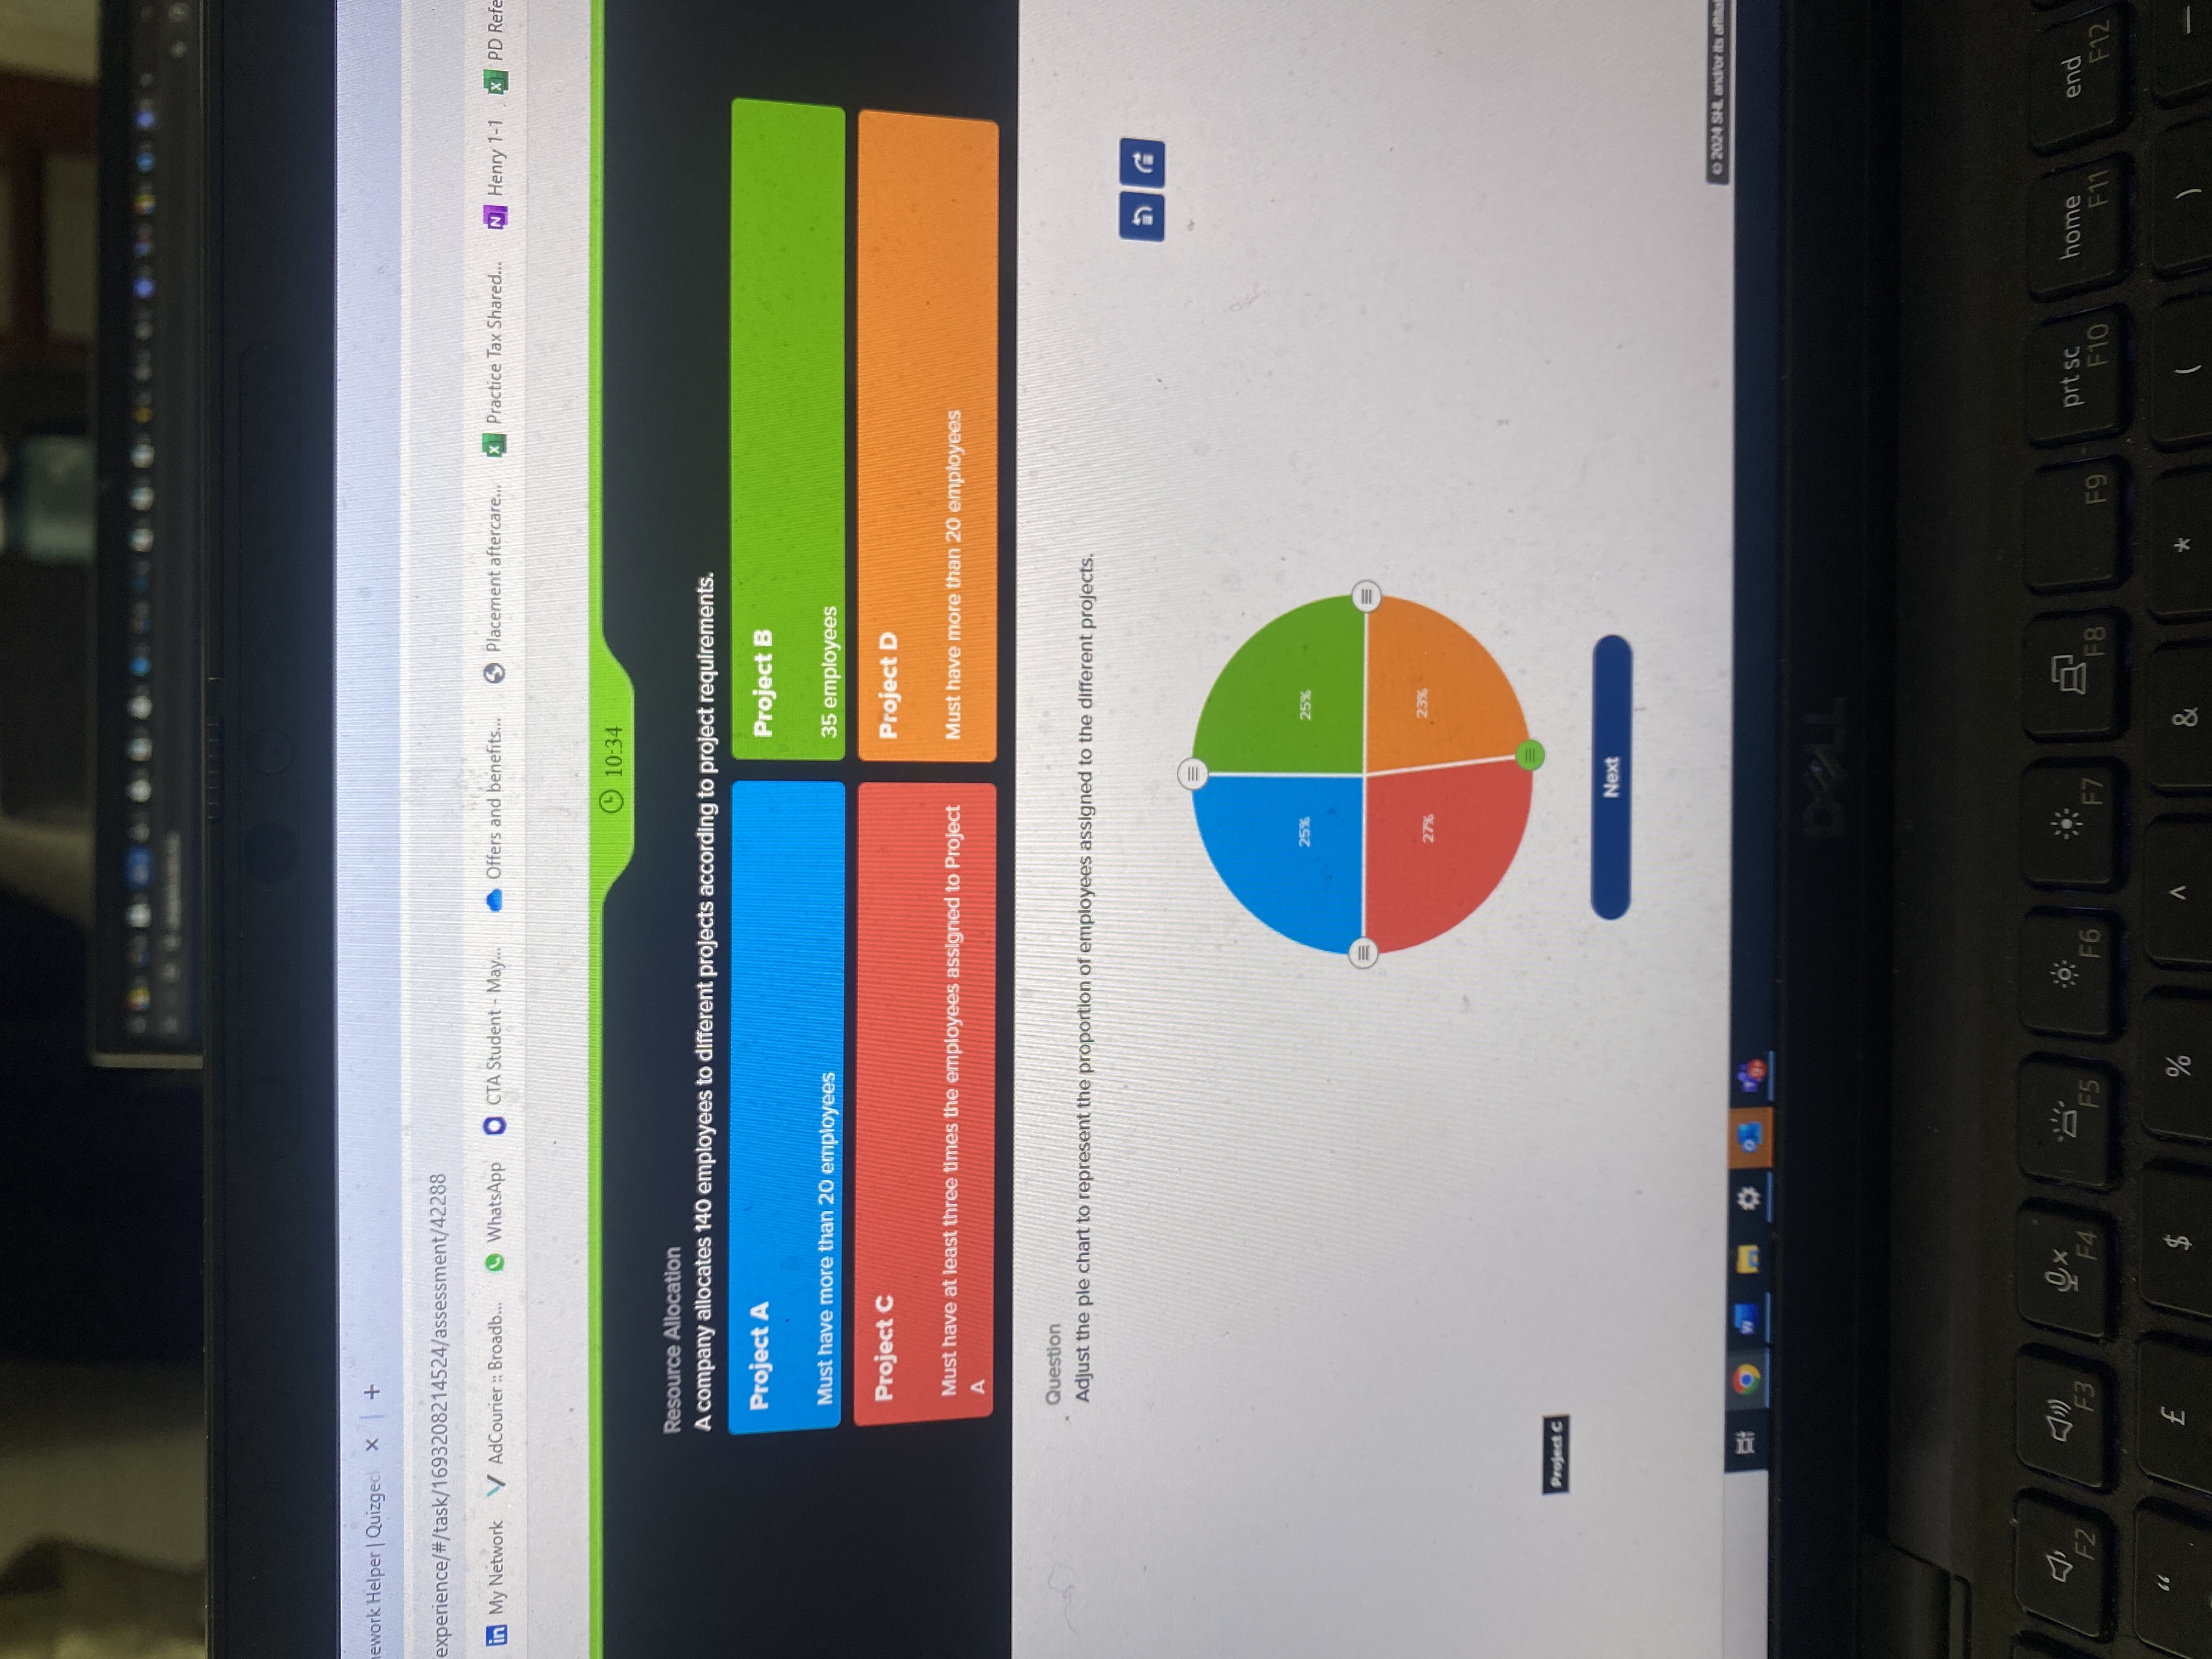
Adjust the pie chart to represent the proportion of employees assigned to the different projects.

Understand the Problem
The question asks to adjust a pie chart to represent the proportion of employees assigned to different projects based on certain conditions regarding the number of employees assigned to each project.
Answer
Project A: $15\%$, Project B: $25\%$, Project C: $45\%$, Project D: $15\%$.
Answer for screen readers
The adjusted proportions for the pie chart are approximately:
- Project A: $15%$
- Project B: $25%$
- Project C: $45%$
- Project D: $15%$
Steps to Solve
-
Define the total number of employees
The company has a total of 140 employees that need to be allocated across the projects. -
Assign Project B employees
Project B requires 35 employees.
So, remaining employees = $140 - 35 = 105$ employees. -
Allocate for Projects A, C, and D
Project A must have more than 20 employees. Let's denote the number of employees assigned to Project A as $x$. -
Determine the relationship for Project C
Project C must have at least three times the employees assigned to Project A. Therefore, if Project A has $x$ employees, Project C must have at least $3x$ employees. -
Determine the relationship for Project D
Project D must have more than 20 employees. Let’s denote the number of employees assigned to Project D as $y$.
We now have the equation:
$$ x + 3x + y = 105 $$
Which simplifies to:
$$ 4x + y = 105 $$
-
Set inequalities
From the requirements, we have:
- $x > 20$ (Project A)
- $y > 20$ (Project D)
-
Solve for the range of $x$
From the equation $y = 105 - 4x$, we also have $y > 20$:
$$ 105 - 4x > 20 $$
$$ 85 > 4x $$
$$ \frac{85}{4} > x $$
This simplifies to:
$$ x < 21.25 $$
Thus, the possible integer values for $x$ are 21, since $x > 20$.
-
Calculate employees for Projects C and D
If ( x = 21: )
$$ 3x = 3(21) = 63 \text{ (Project C)} $$
Then, we calculate ( y ):
$$ y = 105 - 4(21) = 105 - 84 = 21 \text{ (Project D)} $$
-
Final distribution of employees
With these assignments, we have the following:
- Project A: 21 employees
- Project B: 35 employees
- Project C: 63 employees
- Project D: 21 employees
-
Calculate proportions for the pie chart
To find the percentages for the pie chart, calculate:
- Project A: $\frac{21}{140} \times 100 \approx 15%$
- Project B: $\frac{35}{140} \times 100 = 25%$
- Project C: $\frac{63}{140} \times 100 \approx 45%$
- Project D: $\frac{21}{140} \times 100 \approx 15%$
This gives us a final distribution for the pie chart.
The adjusted proportions for the pie chart are approximately:
- Project A: $15%$
- Project B: $25%$
- Project C: $45%$
- Project D: $15%$
More Information
The allocation reflects the requirements for each project, ensuring Project C meets the condition of having three times the employees compared to Project A, while also making sure Projects A and D have more than 20 employees.
Tips
- Failing to set the limits for the number of employees in Projects A and D.
- Not properly calculating the relationship between Projects A, C, and D.
- Forgetting to check for integer solutions for employee assignments.
AI-generated content may contain errors. Please verify critical information