Podcast
Questions and Answers
What fundamental concept is the video primarily focused on?
What fundamental concept is the video primarily focused on?
In the example, how many students were asked to report their water intake?
In the example, how many students were asked to report their water intake?
What does a relative frequency histogram measure?
What does a relative frequency histogram measure?
What was the average water consumption for the student who drank the least amount of water?
What was the average water consumption for the student who drank the least amount of water?
Signup and view all the answers
How is the height of the bar determined in a frequency histogram?
How is the height of the bar determined in a frequency histogram?
Signup and view all the answers
Why might a researcher prefer a relative frequency histogram over a frequency histogram when dealing with a large dataset?
Why might a researcher prefer a relative frequency histogram over a frequency histogram when dealing with a large dataset?
Signup and view all the answers
In the given example, how many data points fell into the category of greater than or equal to 3 and less than 4?
In the given example, how many data points fell into the category of greater than or equal to 3 and less than 4?
Signup and view all the answers
What was the percentage represented by the bar height for the category containing 2 data points in a relative frequency histogram?
What was the percentage represented by the bar height for the category containing 2 data points in a relative frequency histogram?
Signup and view all the answers
What is a key advantage of using a bar chart over a histogram for discrete data?
What is a key advantage of using a bar chart over a histogram for discrete data?
Signup and view all the answers
In what situation might a histogram be appropriate for discrete data?
In what situation might a histogram be appropriate for discrete data?
Signup and view all the answers
Which of the following describes a common limitation of using histograms for discrete data?
Which of the following describes a common limitation of using histograms for discrete data?
Signup and view all the answers
If employing a histogram for data ranging from zero to fifty, what aspect could be less clear?
If employing a histogram for data ranging from zero to fifty, what aspect could be less clear?
Signup and view all the answers
What is generally the first step to take when visualizing a large dataset of discrete data?
What is generally the first step to take when visualizing a large dataset of discrete data?
Signup and view all the answers
How can a frequency polygon be more useful than a histogram for large discrete datasets?
How can a frequency polygon be more useful than a histogram for large discrete datasets?
Signup and view all the answers
What benefit does grouping transaction counts provide in a histogram?
What benefit does grouping transaction counts provide in a histogram?
Signup and view all the answers
What type of data visualization is ideal for highlighting individual category frequencies?
What type of data visualization is ideal for highlighting individual category frequencies?
Signup and view all the answers
For a dataset of customer transactions, what aspect is important to consider when choosing between a bar chart and a histogram?
For a dataset of customer transactions, what aspect is important to consider when choosing between a bar chart and a histogram?
Signup and view all the answers
Why might a data scientist choose to overlook using a histogram despite having sufficient data?
Why might a data scientist choose to overlook using a histogram despite having sufficient data?
Signup and view all the answers
What is the primary purpose of binning in data visualization?
What is the primary purpose of binning in data visualization?
Signup and view all the answers
Which graph type allows for a continuous approximation of data distribution?
Which graph type allows for a continuous approximation of data distribution?
Signup and view all the answers
Why might a histogram be used for discrete data?
Why might a histogram be used for discrete data?
Signup and view all the answers
What does a standard bar chart typically display?
What does a standard bar chart typically display?
Signup and view all the answers
How does the binned bar chart differ from the standard bar chart?
How does the binned bar chart differ from the standard bar chart?
Signup and view all the answers
What is a drawback of using a histogram for discrete data?
What is a drawback of using a histogram for discrete data?
Signup and view all the answers
Which of the following statements about the relationship between bar charts and histograms is true?
Which of the following statements about the relationship between bar charts and histograms is true?
Signup and view all the answers
What is one benefit of using a density curve approximation?
What is one benefit of using a density curve approximation?
Signup and view all the answers
When might a frequency polygon be more useful than a bar chart?
When might a frequency polygon be more useful than a bar chart?
Signup and view all the answers
In which situation is it not advisable to use a histogram?
In which situation is it not advisable to use a histogram?
Signup and view all the answers
What data visualization approach merges benefits of bar charts and density curves?
What data visualization approach merges benefits of bar charts and density curves?
Signup and view all the answers
Which visualization is most appropriate for showing the count distribution of pet ownership?
Which visualization is most appropriate for showing the count distribution of pet ownership?
Signup and view all the answers
What is the primary visual distinction between a binned bar chart and a frequency polygon?
What is the primary visual distinction between a binned bar chart and a frequency polygon?
Signup and view all the answers
What is the main purpose of a histogram?
What is the main purpose of a histogram?
Signup and view all the answers
When is it best to use a bar chart instead of a histogram?
When is it best to use a bar chart instead of a histogram?
Signup and view all the answers
Which of the following is true about density curves?
Which of the following is true about density curves?
Signup and view all the answers
In a histogram, what does the height of the bars represent?
In a histogram, what does the height of the bars represent?
Signup and view all the answers
How do histograms differ from bar charts?
How do histograms differ from bar charts?
Signup and view all the answers
What type of variable would you use a bar chart for if the number of instances is high?
What type of variable would you use a bar chart for if the number of instances is high?
Signup and view all the answers
Which visualization method best suits comparing the number of different types of fruits?
Which visualization method best suits comparing the number of different types of fruits?
Signup and view all the answers
If a dataset includes decimal values such as weights, which type of chart is more suitable?
If a dataset includes decimal values such as weights, which type of chart is more suitable?
Signup and view all the answers
In a bar chart, what does each bar represent?
In a bar chart, what does each bar represent?
Signup and view all the answers
What happens if the bin sizes in a histogram are made very large?
What happens if the bin sizes in a histogram are made very large?
Signup and view all the answers
Why might a density curve be preferred over a histogram for visualizing large data sets?
Why might a density curve be preferred over a histogram for visualizing large data sets?
Signup and view all the answers
If you want to show the frequency of different pet counts among a group, which chart would you typically avoid?
If you want to show the frequency of different pet counts among a group, which chart would you typically avoid?
Signup and view all the answers
What distinguishes discrete data from continuous data?
What distinguishes discrete data from continuous data?
Signup and view all the answers
What is the total area under a density curve?
What is the total area under a density curve?
Signup and view all the answers
Why does a density curve not allow for negative values?
Why does a density curve not allow for negative values?
Signup and view all the answers
How can one estimate the percentage of data falling between two points on a density curve?
How can one estimate the percentage of data falling between two points on a density curve?
Signup and view all the answers
What happens when categories in a dataset are made increasingly granular?
What happens when categories in a dataset are made increasingly granular?
Signup and view all the answers
What misconception is clarified regarding the percentage of data at an exact value on a density curve?
What misconception is clarified regarding the percentage of data at an exact value on a density curve?
Signup and view all the answers
If the width of an interval on a density curve is 0.2 and the height is 0.2, what is the approximate area of that rectangle?
If the width of an interval on a density curve is 0.2 and the height is 0.2, what is the approximate area of that rectangle?
Signup and view all the answers
What does a density curve represent in data visualization?
What does a density curve represent in data visualization?
Signup and view all the answers
If data is being analyzed with a density curve, which of the following intervals would likely yield accurate results?
If data is being analyzed with a density curve, which of the following intervals would likely yield accurate results?
Signup and view all the answers
What is a famous density curve that will be studied later?
What is a famous density curve that will be studied later?
Signup and view all the answers
In the context of density curves, what does 'granular' refer to?
In the context of density curves, what does 'granular' refer to?
Signup and view all the answers
Which of the following best describes the relationship between data intervals and their estimations on a density curve?
Which of the following best describes the relationship between data intervals and their estimations on a density curve?
Signup and view all the answers
Why might exact values in a dataset be less practical when analyzed on a density curve?
Why might exact values in a dataset be less practical when analyzed on a density curve?
Signup and view all the answers
If you have a density curve that indicates 40% of data falls between two glasses of water, what does this tell you?
If you have a density curve that indicates 40% of data falls between two glasses of water, what does this tell you?
Signup and view all the answers
What would be an appropriate interval to estimate data around the value of 3 glasses of water?
What would be an appropriate interval to estimate data around the value of 3 glasses of water?
Signup and view all the answers
Study Notes
Visualizing Data Distributions
- Data can be visualized using frequency histograms, showing the number of data points in each category.
- Relative frequency histograms display the percentage of data points in each category.
- By increasing the number of categories and making them smaller, you can create a smoother visualization.
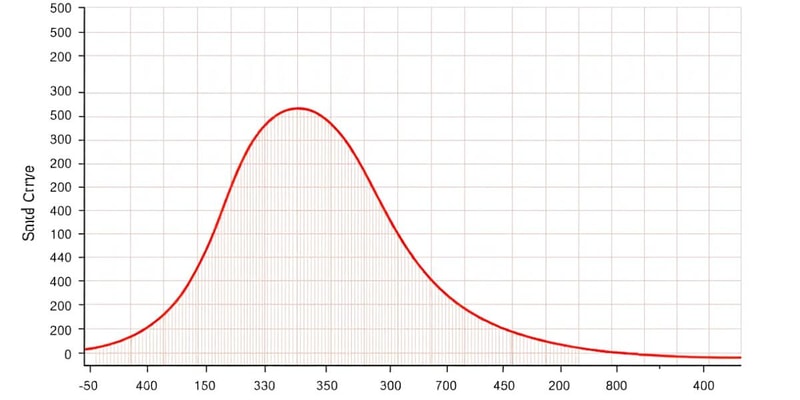
- Connecting the tops of these smaller bars creates a density curve.
Density Curves
- Density curves visualize data where values can take on any value within a continuum.
- The total area under the density curve represents 100% of the data.
- The area under the curve between two values represents the percentage of data within that interval.
- Density curves are often used in statistics to understand data distributions.
Misconceptions about Density Curves:
- Estimating the percentage of data at a single, exact value by looking at the height of the curve is incorrect.
- The percentage is represented by the area under the curve, and a single point has no area.
- To estimate the percentage of data within a small interval, approximate the area under the curve using a rectangle.
- The height is the curve's value, while the width of the rectangle represents the interval.
Histograms vs. Bar Charts
- Histograms are well-suited for visualizing continuous data, where data can take on any value within a range.
- Bar charts are commonly used for discrete data, where values are distinct and countable (e.g., number of pets).
- A bar chart can visualize discrete data even with a large dataset, but with many categories, binning can improve clarity.
- Discrete data can sometimes be visualized using a histogram, especially if the values are numerous and closely spaced.
- Consider the nature of the data and the intended purpose when choosing between a histogram and a bar chart.
Histograms for Discrete Data
- Histograms are suitable for grouping discrete data into intervals or ranges, especially when there are many unique values.
- For discrete data, a bar chart is generally preferred for clarity as it shows each value separately.
- Visualizing customer transaction data (discrete) using a histogram with a wide range of unique values can help understand the distribution of transactions without focusing on each individual count.
- A bar chart is preferred for discrete data when the exact counts for each specific value need to be visualized and interpreted.
- A histogram is useful when a general overview of the distribution patterns is desired.
Studying That Suits You
Use AI to generate personalized quizzes and flashcards to suit your learning preferences.
Description
This quiz focuses on the visualization of data distributions using frequency and relative frequency histograms, as well as density curves. It covers key concepts such as the area under the density curve and common misconceptions regarding their interpretation. Test your understanding of these important statistical tools.


