Podcast
Questions and Answers
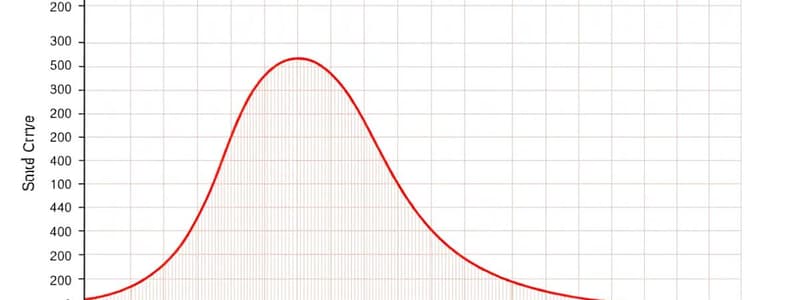
What are the properties of a Normal density curve?
What are the properties of a Normal density curve?
It is above the x-axis. The area under the curve is equal to 1. It is symmetric. The mean and median are in the same place.
If every observation of a data set is multiplied by -3, the mean will be multiplied by ______.
If every observation of a data set is multiplied by -3, the mean will be multiplied by ______.
-3
What happens to the mean when adding 5 and then multiplying by 6?
What happens to the mean when adding 5 and then multiplying by 6?
The mean will be increased by 5 and multiplied by 6.
The 12th percentile is the number x such that which of the following options is true? (Select all that apply)
The 12th percentile is the number x such that which of the following options is true? (Select all that apply)
What is the z-score for Johnny's test score of 61 if the mean is 68 and standard deviation is 4?
What is the z-score for Johnny's test score of 61 if the mean is 68 and standard deviation is 4?
What will the mean and standard deviation be if you standardize a normally distributed data set with mean 14 and standard deviation 3?
What will the mean and standard deviation be if you standardize a normally distributed data set with mean 14 and standard deviation 3?
99.7% of the area under a Normal density curve is within three standard deviations of the mean.
99.7% of the area under a Normal density curve is within three standard deviations of the mean.
What is the z-score for the Seattle Seahawks if they allowed 14.4 points per game?
What is the z-score for the Seattle Seahawks if they allowed 14.4 points per game?
If the foot size of 95% American men is between 9" and 11", what is your estimate of the standard deviation?
If the foot size of 95% American men is between 9" and 11", what is your estimate of the standard deviation?
What is the proportion of surfboards with a volume less than 45 CL's given a mean of 44.8 CL's and a standard deviation of 0.3 CL's?
What is the proportion of surfboards with a volume less than 45 CL's given a mean of 44.8 CL's and a standard deviation of 0.3 CL's?
What should the value of x be set at so that 99% of 8-oz cups do not overflow?
What should the value of x be set at so that 99% of 8-oz cups do not overflow?
What value should x be set at to ensure only 2% of 1 liter cups will overflow?
What value should x be set at to ensure only 2% of 1 liter cups will overflow?
What proportion of M&M packets are underweight if the actual weight follows a Normal distribution with a mean of 16.7 ounces?
What proportion of M&M packets are underweight if the actual weight follows a Normal distribution with a mean of 16.7 ounces?
What is the standard deviation of the test scores if the upper and lower quartiles are 65 and 82?
What is the standard deviation of the test scores if the upper and lower quartiles are 65 and 82?
Which option results in about 60% of the PSAT scores between certain values? (Select the closest option)
Which option results in about 60% of the PSAT scores between certain values? (Select the closest option)
How many surfboards should the manager order if they accept a 1% chance that an item will be sold out?
How many surfboards should the manager order if they accept a 1% chance that an item will be sold out?
About how many babies were born weighing more than 7.5 lbs if 225 babies were born and the weights are normally distributed?
About how many babies were born weighing more than 7.5 lbs if 225 babies were born and the weights are normally distributed?
What proportion of games did the Raiders score less than 30 points?
What proportion of games did the Raiders score less than 30 points?
What proportion of games did the Raiders score between 14 and 28 points?
What proportion of games did the Raiders score between 14 and 28 points?
How many points would the Raiders need to score to be in the top 10% of their scores?
How many points would the Raiders need to score to be in the top 10% of their scores?
Flashcards are hidden until you start studying
Study Notes
Normal Density Curve Properties
- Area under a Normal density curve equals 1.
- Curve is symmetric about the mean and median; both are at the same point.
- Peak of the curve is centered above the mean and median.
Effects of Transformations on Data Set
- Multiplying every observation by -3 results in both mean and median being multiplied by -3.
- Standard deviation is multiplied by +3, and variance is squared (resulting in 9).
- IQR also gets multiplied by -3.
Adding and Multiplying Transformation Effects
- Adding 5 to each number increases the mean by 5 and then multiplying by 6 scales the mean accordingly.
- IQR and standard deviation are only scaled by 6 (adding does not affect them).
- Distribution shape remains unchanged by such transformations.
Understanding Percentiles
- 12th percentile indicates that 12% of scores are below that value; thus, 88% are above it.
Z-Score Calculation
- Z-score for a skewed distribution can be computed using the formula: ( z = \frac{(x - \mu)}{\sigma} ).
- Example: For a score of 61 with a mean of 68 and standard deviation of 4, the z-score is -1.75.
Standardization Results
- Standardizing a normally distributed dataset (mean of 14, std dev of 3) transforms its mean to 0 and standard deviation to 1.
Properties of Normal Density Curves
- Properties include: peak at mean, 99.7% of the area is within three standard deviations, symmetry, mean close to median.
Z-Score of Specific Game Performance
- Example with Seattle Seahawks whose mean points allowed is 23.4 and standard deviation is 4.08; z-score for allowing 14.4 points per game calculated as -2.21.
Estimating Standard Deviation
- If foot sizes of 95% of men range between 9" and 11", the estimated standard deviation is approximately 0.5 inches.
Proportion of Values Below a Mean
- Surfboard volumes with a Normal distribution (mean 44.8 CL, std dev 0.3 CL) indicates about 74.75% are below 45 CL.
Setting Machine Output for Non-overflow
- To ensure that 99% of cups do not overflow, average ounces per cup should be set around 6.37 oz.
Coffee Dispenser Regulation
- Average x liters should be set so that only 2% of 1-liter cups overflow; this is approximately 0.795 liters.
Weight Distribution of M&M Packages
- Proportion of packets underweight (below 16 ounces) is estimated at 4% based on mean and std deviation.
Standard Deviation Calculation from Quartiles
- For normally distributed test scores with quartiles at 65 and 82, standard deviation calculated as 12.6.
Scoring in a Normal Distribution
- To find the scoring range for high school PSAT scores with a mean of 102 and std dev of 8, calculating between the specified ranges yields desired proportions.
Ordering for Demand in a Sale
- To avoid stockouts in a sale with a mean demand of 225 and standard deviation of 13, manager should order approximately 255 items for a 1% stockout risk.
Weight Analysis of Newborns
- Analyzing a sample of 225 newborns, calculate how many weighed more than 7.5 lbs based on weight distribution parameters.
Distribution of NFL Points Scored
- Various questions address the scoring of the Oakland Raiders during their season, analyzing distributions and proportions for scores below and between specified thresholds.
Studying That Suits You
Use AI to generate personalized quizzes and flashcards to suit your learning preferences.