Podcast
Questions and Answers
What is the primary benefit of using density curves in stock analysis?
What is the primary benefit of using density curves in stock analysis?
- They summarize complex data to highlight trends and patterns. (correct)
- They provide a definitive prediction of future stock prices.
- They replace the need for quantitative data analysis.
- They analyze data without considering historical performance.
When are density curves most effective?
When are density curves most effective?
- When exact values need to be maintained.
- When analyzing qualitative data.
- When working with a small sample size.
- When dealing with large, continuous quantitative data sets. (correct)
How does a density curve differ from a histogram?
How does a density curve differ from a histogram?
- Density curves provide a clearer overall view by smoothing frequencies. (correct)
- Density curves focus solely on frequency.
- Histograms are always smoother than density curves.
- Histograms cannot be created from continuous data.
What information does the shape of a density curve provide?
What information does the shape of a density curve provide?
Which type of distribution is often a good fit for stock returns when using density curves?
Which type of distribution is often a good fit for stock returns when using density curves?
What is one practical application of density curves in finance?
What is one practical application of density curves in finance?
Which of the following is NOT a key takeaway about density curves?
Which of the following is NOT a key takeaway about density curves?
What role do density curves play in comparing different stocks?
What role do density curves play in comparing different stocks?
What distinguishes a regular frequency distribution from a relative frequency distribution?
What distinguishes a regular frequency distribution from a relative frequency distribution?
How do you convert a frequency distribution into a relative frequency distribution?
How do you convert a frequency distribution into a relative frequency distribution?
What is a defining characteristic of density curves?
What is a defining characteristic of density curves?
What advantage do density curves have over histograms?
What advantage do density curves have over histograms?
In a dataset of 20 individuals, if 6 individuals weigh between 100 and 110 pounds, what is the relative frequency for that weight interval?
In a dataset of 20 individuals, if 6 individuals weigh between 100 and 110 pounds, what is the relative frequency for that weight interval?
What does it mean if the sum of relative frequencies of all intervals equals 1?
What does it mean if the sum of relative frequencies of all intervals equals 1?
Why might the picture of a histogram differ?
Why might the picture of a histogram differ?
Which of the following correctly describes a histogram?
Which of the following correctly describes a histogram?
Why are density curves particularly useful for large populations?
Why are density curves particularly useful for large populations?
What is a critical property of a valid density curve?
What is a critical property of a valid density curve?
What does the area of a density curve above a specific point represent?
What does the area of a density curve above a specific point represent?
For a valid density curve with a length of 8, what must its width be to maintain an area of 1?
For a valid density curve with a length of 8, what must its width be to maintain an area of 1?
What percentage of individuals weigh exactly 150 pounds according to the concept of a density curve?
What percentage of individuals weigh exactly 150 pounds according to the concept of a density curve?
Which type of distribution is characterized by each interval having the same frequency of data values?
Which type of distribution is characterized by each interval having the same frequency of data values?
What is the primary reason density curves are easier to work with than histograms?
What is the primary reason density curves are easier to work with than histograms?
What proportion of values lies between the intervals of 12.3 and 18.6 if the area is calculated as 0.315?
What proportion of values lies between the intervals of 12.3 and 18.6 if the area is calculated as 0.315?
What must the total area under any valid density curve sum to?
What must the total area under any valid density curve sum to?
Which distribution is often referred to as the bell curve?
Which distribution is often referred to as the bell curve?
Why is calculating areas under the density curve important?
Why is calculating areas under the density curve important?
What does it imply if a density curve dips below the horizontal axis?
What does it imply if a density curve dips below the horizontal axis?
When working with test score data from 1 million individuals, what can be said about those scoring over 60?
When working with test score data from 1 million individuals, what can be said about those scoring over 60?
What does the area under a density curve represent?
What does the area under a density curve represent?
In which scenario is a density curve considered most useful?
In which scenario is a density curve considered most useful?
Why might someone prefer a density curve over a histogram?
Why might someone prefer a density curve over a histogram?
What type of data is most appropriate for using density curves?
What type of data is most appropriate for using density curves?
How can you create a density curve from a histogram?
How can you create a density curve from a histogram?
What does a peak in a density curve indicate?
What does a peak in a density curve indicate?
What might a density curve skewed to the right suggest in healthcare?
What might a density curve skewed to the right suggest in healthcare?
What risk does using too few bins in a histogram present?
What risk does using too few bins in a histogram present?
What aspect of data does a density curve analyze?
What aspect of data does a density curve analyze?
In a density curve representing stock returns, what does a long tail indicate?
In a density curve representing stock returns, what does a long tail indicate?
Which of the following is important when selecting bins for a histogram?
Which of the following is important when selecting bins for a histogram?
How is a normal distribution typically depicted in analysis?
How is a normal distribution typically depicted in analysis?
What limitation does a histogram have compared to a density curve?
What limitation does a histogram have compared to a density curve?
Why might you want to analyze a dataset using a density curve in finance?
Why might you want to analyze a dataset using a density curve in finance?
What is a primary characteristic of density curves?
What is a primary characteristic of density curves?
Flashcards
Density Curve in Stock Analysis
Density Curve in Stock Analysis
A smooth curve summarizing complex stock data to highlight trends and patterns, useful for large datasets.
Density Curve vs. Histogram
Density Curve vs. Histogram
Density curves provide a smoother view of overall data distribution, while histograms show frequency in intervals.
Density Curve Shape
Density Curve Shape
Reveals insights into central tendency (middle) and data variability (spread).
Stock Returns and Normal Distribution
Stock Returns and Normal Distribution
Signup and view all the flashcards
Historical Stock Performance
Historical Stock Performance
Signup and view all the flashcards
Density Curve Application in Finance
Density Curve Application in Finance
Signup and view all the flashcards
Relative Frequency Distribution
Relative Frequency Distribution
Signup and view all the flashcards
Frequency to Relative Frequency
Frequency to Relative Frequency
Signup and view all the flashcards
Density Curve Area
Density Curve Area
Signup and view all the flashcards
Density Curve Idealization
Density Curve Idealization
Signup and view all the flashcards
Histogram Usefulness
Histogram Usefulness
Signup and view all the flashcards
Large Population Representation
Large Population Representation
Signup and view all the flashcards
Valid Density Curve
Valid Density Curve
Signup and view all the flashcards
Probability using Density Curve
Probability using Density Curve
Signup and view all the flashcards
Density Curve Width
Density Curve Width
Signup and view all the flashcards
Uniform Distribution
Uniform Distribution
Signup and view all the flashcards
Density Curve and Histograms
Density Curve and Histograms
Signup and view all the flashcards
Area Calculation and Probability
Area Calculation and Probability
Signup and view all the flashcards
Invalid Density Curve
Invalid Density Curve
Signup and view all the flashcards
Normal Distribution
Normal Distribution
Signup and view all the flashcards
Probability Estimation
Probability Estimation
Signup and view all the flashcards
Study Notes
Density Curves
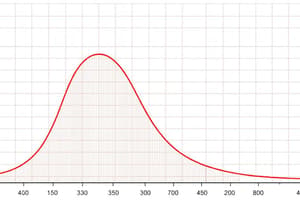
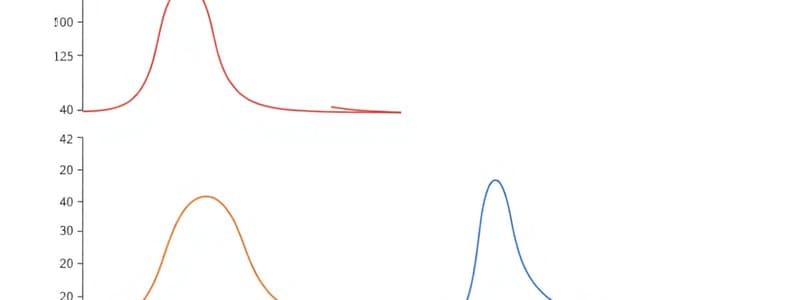
- A density curve is a smooth curve that represents the overall shape of a distribution.
- It is a visual representation of a relative frequency distribution.
- The total area under a density curve is always equal to 1 or 100%.
- Density curves are used to represent distributions in a more idealized way than histograms because they don't consider outliers or irregularities.
- Density curves are particularly useful for working with large populations because they are not limited by the number of intervals.
- Density curves can be used to make approximations about the distribution of data.
Properties of Density Curves
- A density curve must lie on or above the horizontal axis.
- The total area under a density curve is always equal to 1.
Types of Density Curves
- Uniform Distribution: Each interval has the same frequency of data values.
- Triangular Distribution: The shape resembles a triangle.
- Normal Distribution (Bell Curve): The most common and important density curve in statistics.
Using Density Curves in Practice
- Example 1: In a density curve representing the weights of people, the area under the curve between 150 and 152 pounds represents the proportion of people who weigh between those values.
- Example 2: In a uniform distribution, the width of the curve is determined by the area under the curve (which is always 1) and the length of the interval.
- Example 3: In a uniform distribution, the proportion of values between two points is calculated by finding the area of the rectangle enclosed by those points and the horizontal axis.
Histogram vs. Density Curve
- Histograms are discrete representations of frequency distributions, while density curves are continuous representations.
- Histograms are limited by the number of intervals, while density curves are not.
- Density curves provide a smoother and more idealized view of the data than histograms.
Studying That Suits You
Use AI to generate personalized quizzes and flashcards to suit your learning preferences.