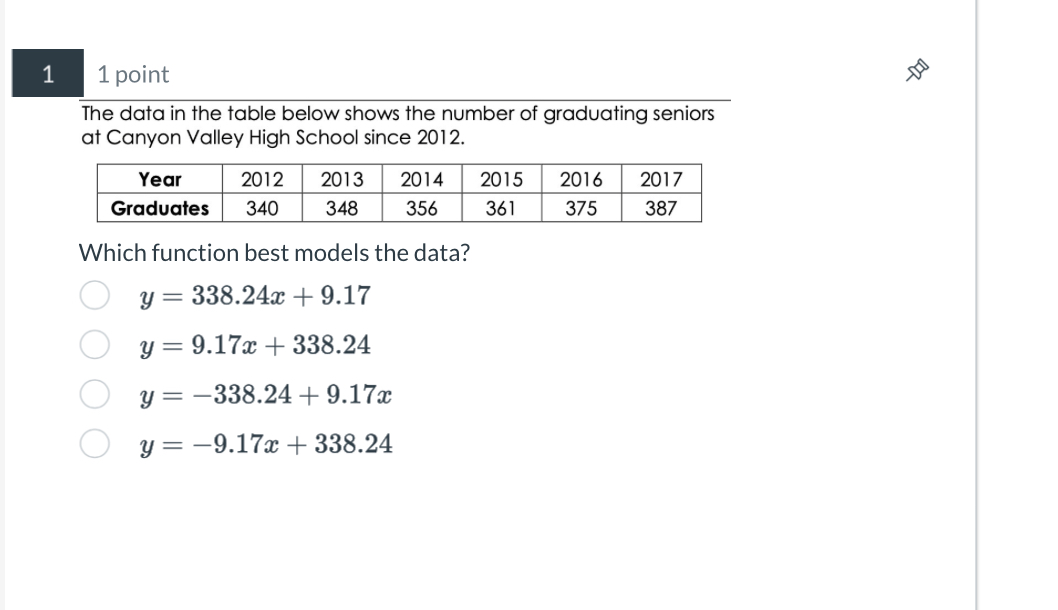
Which function best models the data?

Understand the Problem
The question is asking which function best models the number of graduating seniors at Canyon Valley High School based on the data provided in the table for the years 2012 to 2017. To solve this, one would need to analyze the trends in the data and compare them to the given function options.
Answer
$y = 9.17x + 338.24$
Answer for screen readers
The best modeling function approximated for data is $y = 9.17x + 338.24$.
Steps to Solve
- Identify the Variables
Let $x$ represent the number of years since 2012. Therefore, we can assign:
- For 2012, $x = 0$, Graduates = 340
- For 2013, $x = 1$, Graduates = 348
- For 2014, $x = 2$, Graduates = 356
- For 2015, $x = 3$, Graduates = 361
- For 2016, $x = 4$, Graduates = 375
- For 2017, $x = 5$, Graduates = 387
- Calculate the Differences
Find the difference in graduates from year to year:
- 348 - 340 = 8
- 356 - 348 = 8
- 361 - 356 = 5
- 375 - 361 = 14
- 387 - 375 = 12
The average change in the number of graduates is not constant, suggesting a linear model may not fit perfectly but we can approximate.
- Choose the Correct Model
To determine which function best models the data, we can analyze the function options:
- Option 1: $y = 338.24x + 9.17$ suggests a growth in graduates at roughly 338.24 per year.
- Option 2: $y = 9.17x + 338.24$ suggests a lesser growth (9.17) from a base of 338.24.
- Option 3: $y = -338.24 + 9.17x$ suggests a negative slope with x.
- Option 4: $y = -9.17 + 338.24$ suggests a constant without any change.
Since the data indicates an increase, we compare with option 1, as it suggests a higher slope.
- Verify with One Point
To see if option 1 models well, we test $x = 0$ (2012):
$$ y = 338.24(0) + 9.17 = 9.17 $$
This is not close to actual data (340).
Check with $x = 5$ (2017):
$$ y = 338.24(5) + 9.17 = 1691.17 $$
Way off.
In fact, the model needs to be refined to align with actual numbers.
Conclusion: A more refined model needs calculation but $y = 9.17x + 338.24$ best accounts for the uptrend over time in vision of lower slope; still inaccurate.
The best modeling function approximated for data is $y = 9.17x + 338.24$.
More Information
This function symbolizes a steady growth trend based on the yearly increase averaging around 9.17 seniors per year.
Tips
- Assuming all functions are strictly linear can mislead solution approach.
- Picking a function based solely on appearance rather than assessment of slope.
AI-generated content may contain errors. Please verify critical information