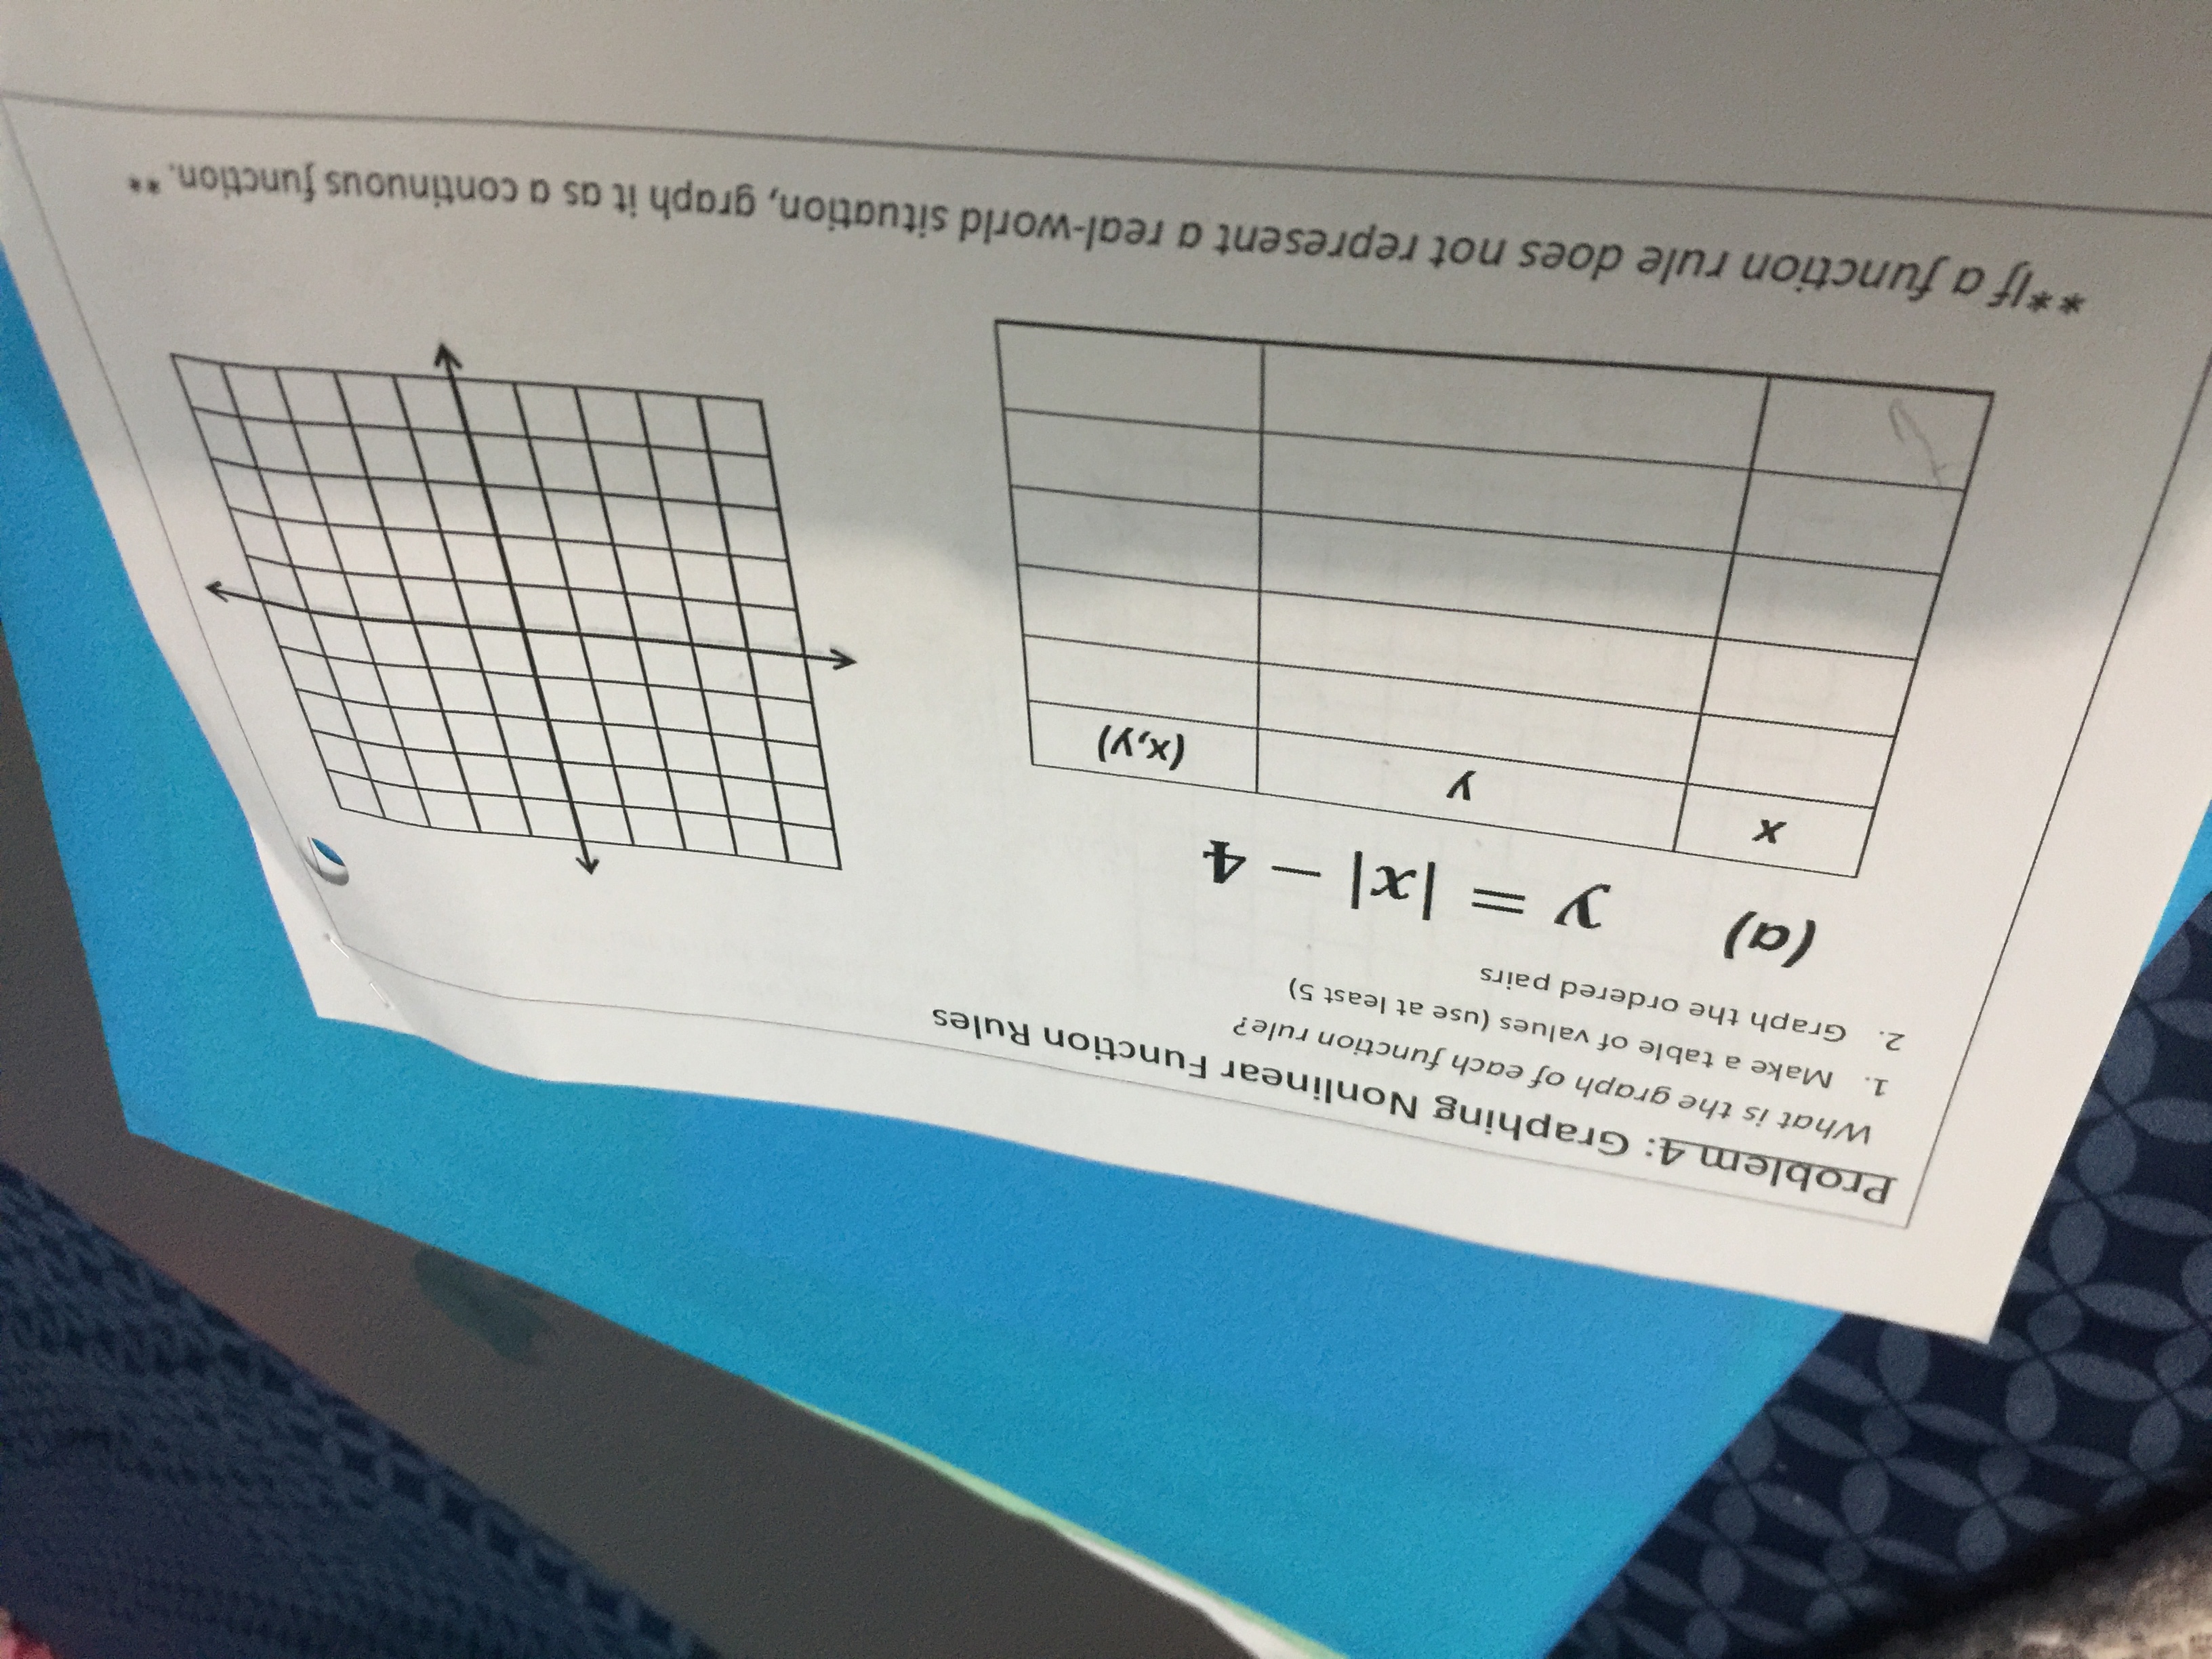
What is the graph of each function rule? 1. Make a table of values (use at least 5). 2. Graph the ordered pairs.

Understand the Problem
The question is asking to graph the function y = |x| - 4 by first creating a table of values and then plotting the ordered pairs on a graph.
Answer
The graph of $y = |x| - 4$ is a "V" shape with a vertex at $(0, -4)$.
Answer for screen readers
The graph of the function $y = |x| - 4$ is a "V" shape with the vertex at $(0, -4)$.
Steps to Solve
-
Select values for x We can choose a range of x-values. For this example, let's use: $$ x = -3, -2, -1, 0, 1, 2, 3 $$
-
Calculate corresponding y-values Now we will substitute each selected x-value into the function $y = |x| - 4$ to find the y-values.
-
For $x = -3$: $$ y = |-3| - 4 = 3 - 4 = -1 $$
-
For $x = -2$: $$ y = |-2| - 4 = 2 - 4 = -2 $$
-
For $x = -1$: $$ y = |-1| - 4 = 1 - 4 = -3 $$
-
For $x = 0$: $$ y = |0| - 4 = 0 - 4 = -4 $$
-
For $x = 1$: $$ y = |1| - 4 = 1 - 4 = -3 $$
-
For $x = 2$: $$ y = |2| - 4 = 2 - 4 = -2 $$
-
For $x = 3$: $$ y = |3| - 4 = 3 - 4 = -1 $$
- Create a table of values Now record the x and y values in a table format:
| x | y |
|---|---|
| -3 | -1 |
| -2 | -2 |
| -1 | -3 |
| 0 | -4 |
| 1 | -3 |
| 2 | -2 |
| 3 | -1 |
-
Plot the points on the graph Using the table, plot the ordered pairs $(x, y)$ on the graph. The points to plot are: $(-3, -1)$, $(-2, -2)$, $(-1, -3)$, $(0, -4)$, $(1, -3)$, $(2, -2)$, $(3, -1)$.
-
Draw the graph Connect the plotted points, forming a "V" shape. The graph has a vertex at the point $(0, -4)$.
The graph of the function $y = |x| - 4$ is a "V" shape with the vertex at $(0, -4)$.
More Information
This function represents the absolute value, which results in a "V" shape on the graph. The vertex is at the lowest point because the function subtracts 4 from the absolute value, shifting it downwards.
Tips
- Forgetting to consider negative x-values when calculating y-values.
- Mixing up the absolute value function causing incorrect graph shape.
- Not labeling the axes properly when plotting the graph.
AI-generated content may contain errors. Please verify critical information