Understand the Problem
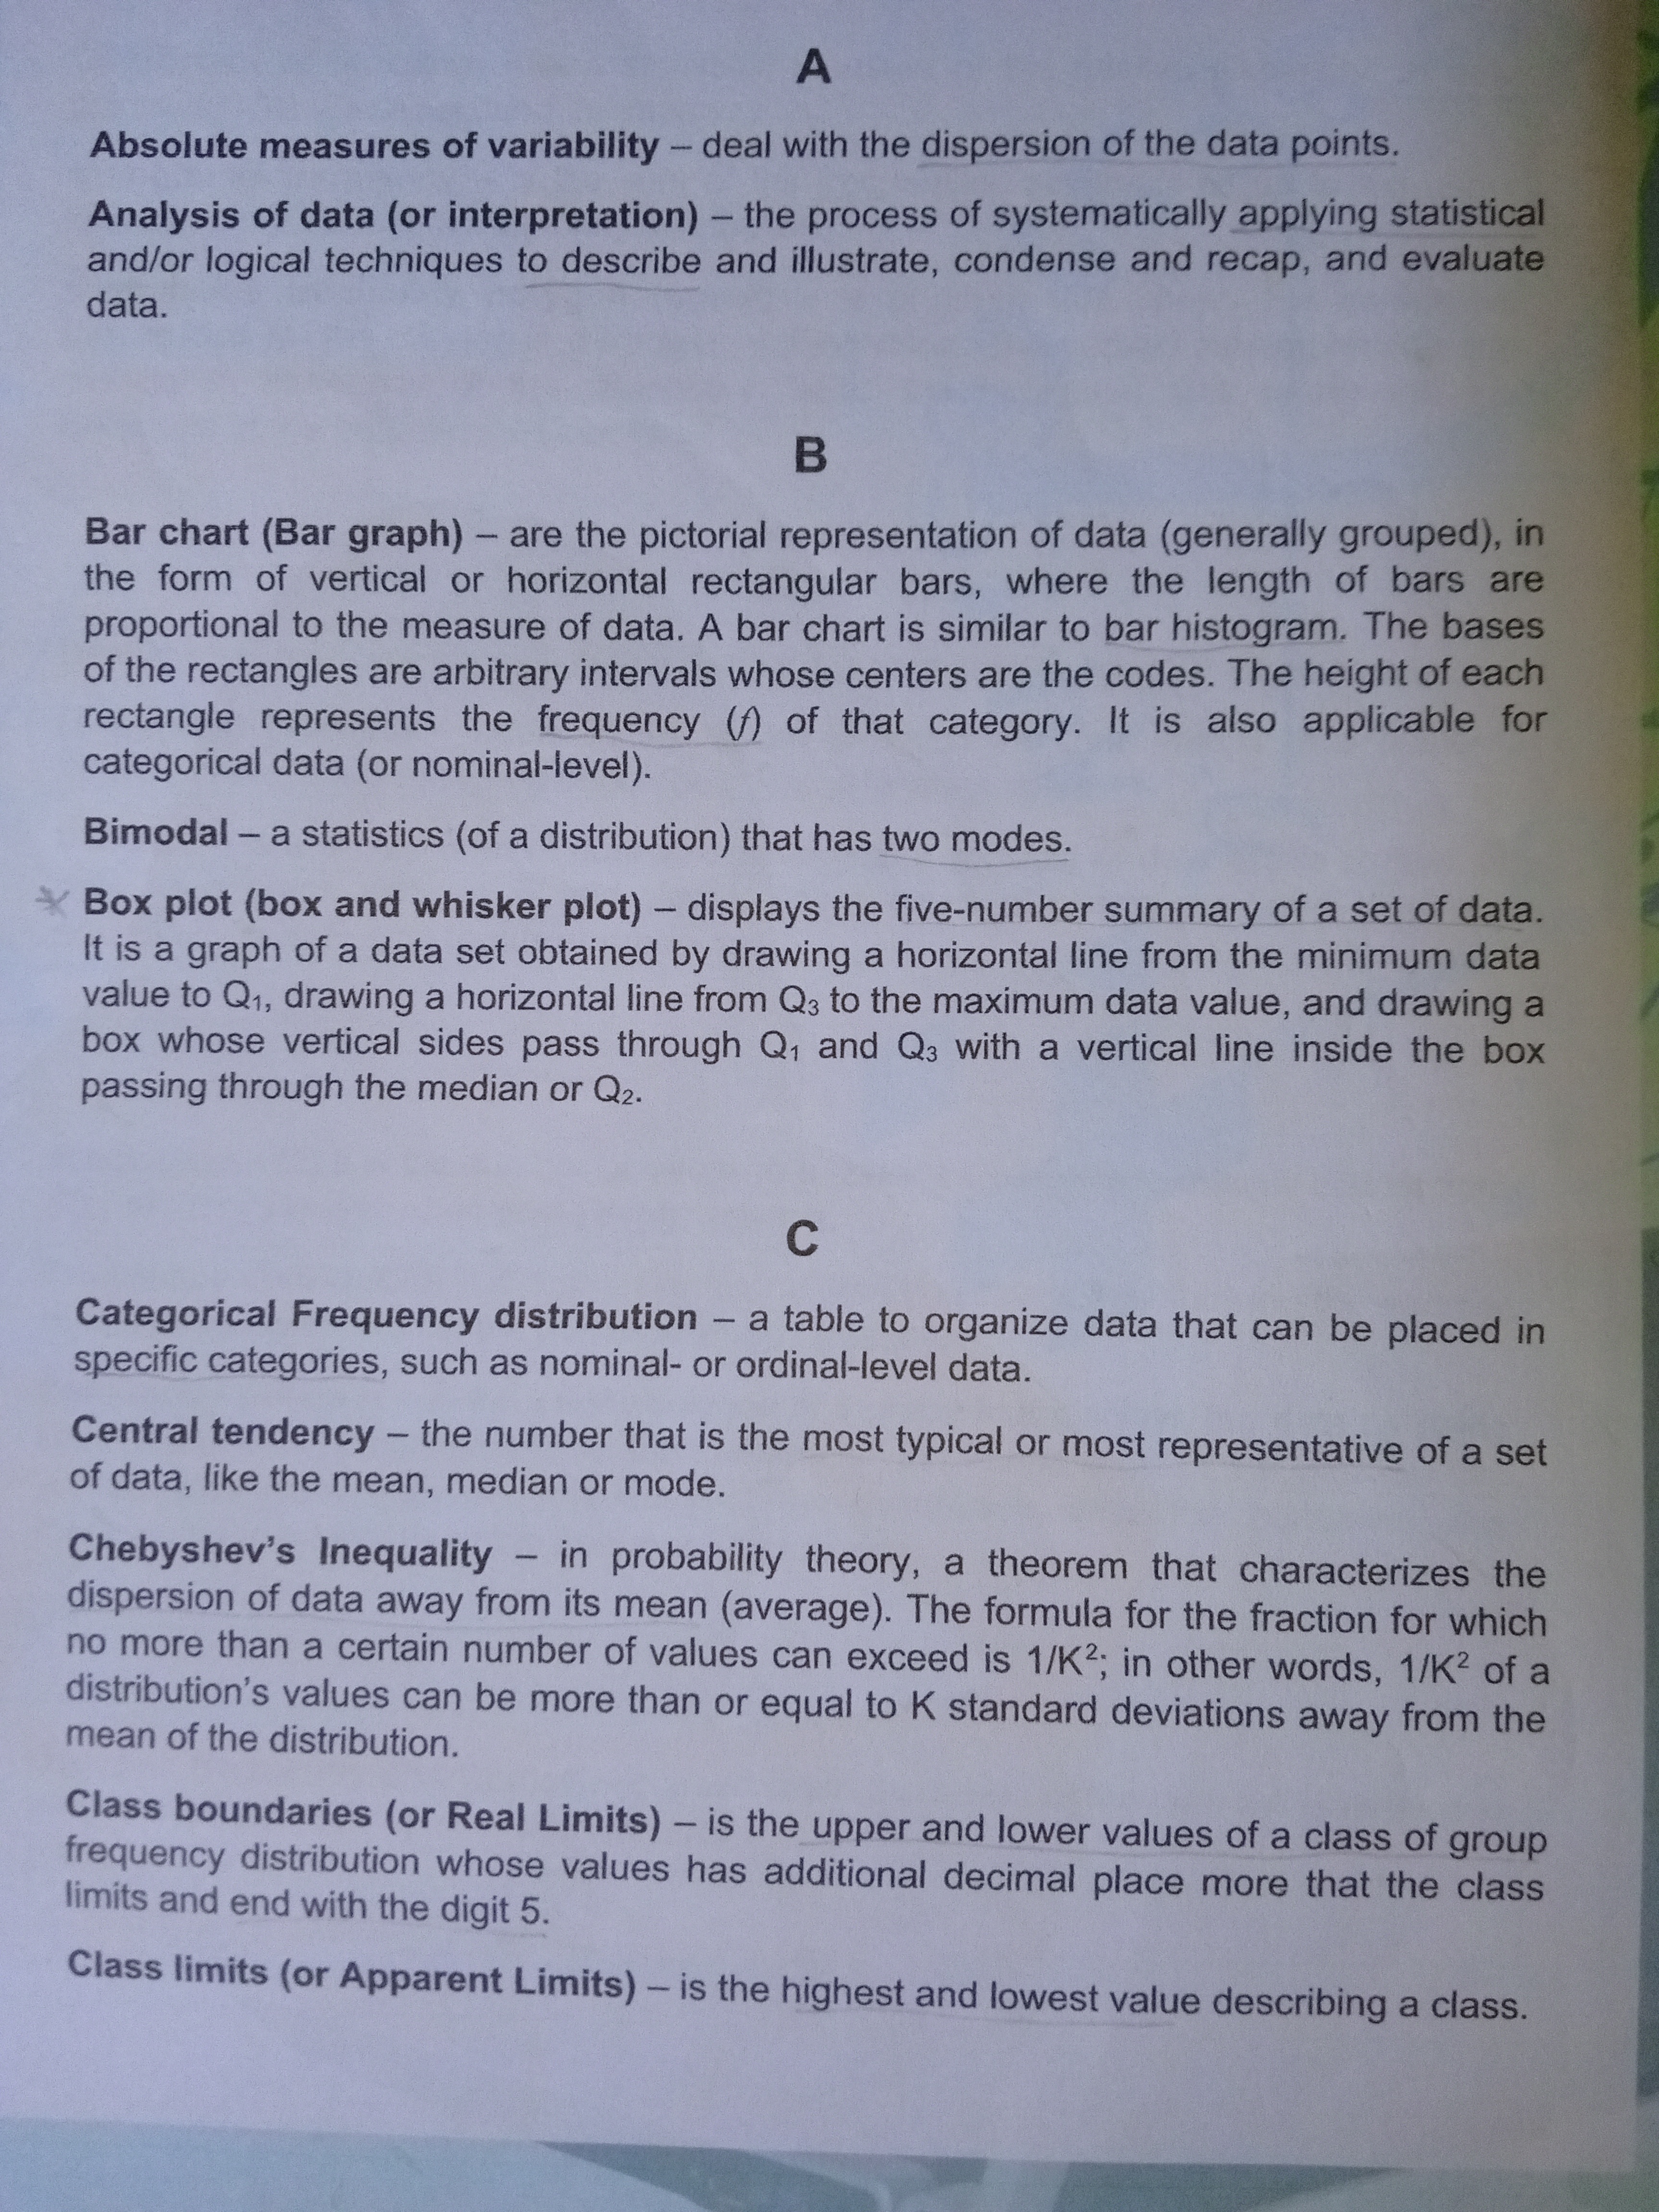
The text provides definitions and explanations of various statistical terms and concepts, likely for educational purposes. It covers measures of variability, data representation methods, frequency distributions, and fundamental statistical concepts.
Answer
The image explains statistical terms like bar chart, bimodal, and box plot.
The image provides definitions of statistical terms such as bar chart, bimodal, and box plot.
Answer for screen readers
The image provides definitions of statistical terms such as bar chart, bimodal, and box plot.
More Information
A bar chart is used for categorical data visualization, a bimodal distribution has two peaks, and a box plot shows the five-number summary of data.
AI-generated content may contain errors. Please verify critical information