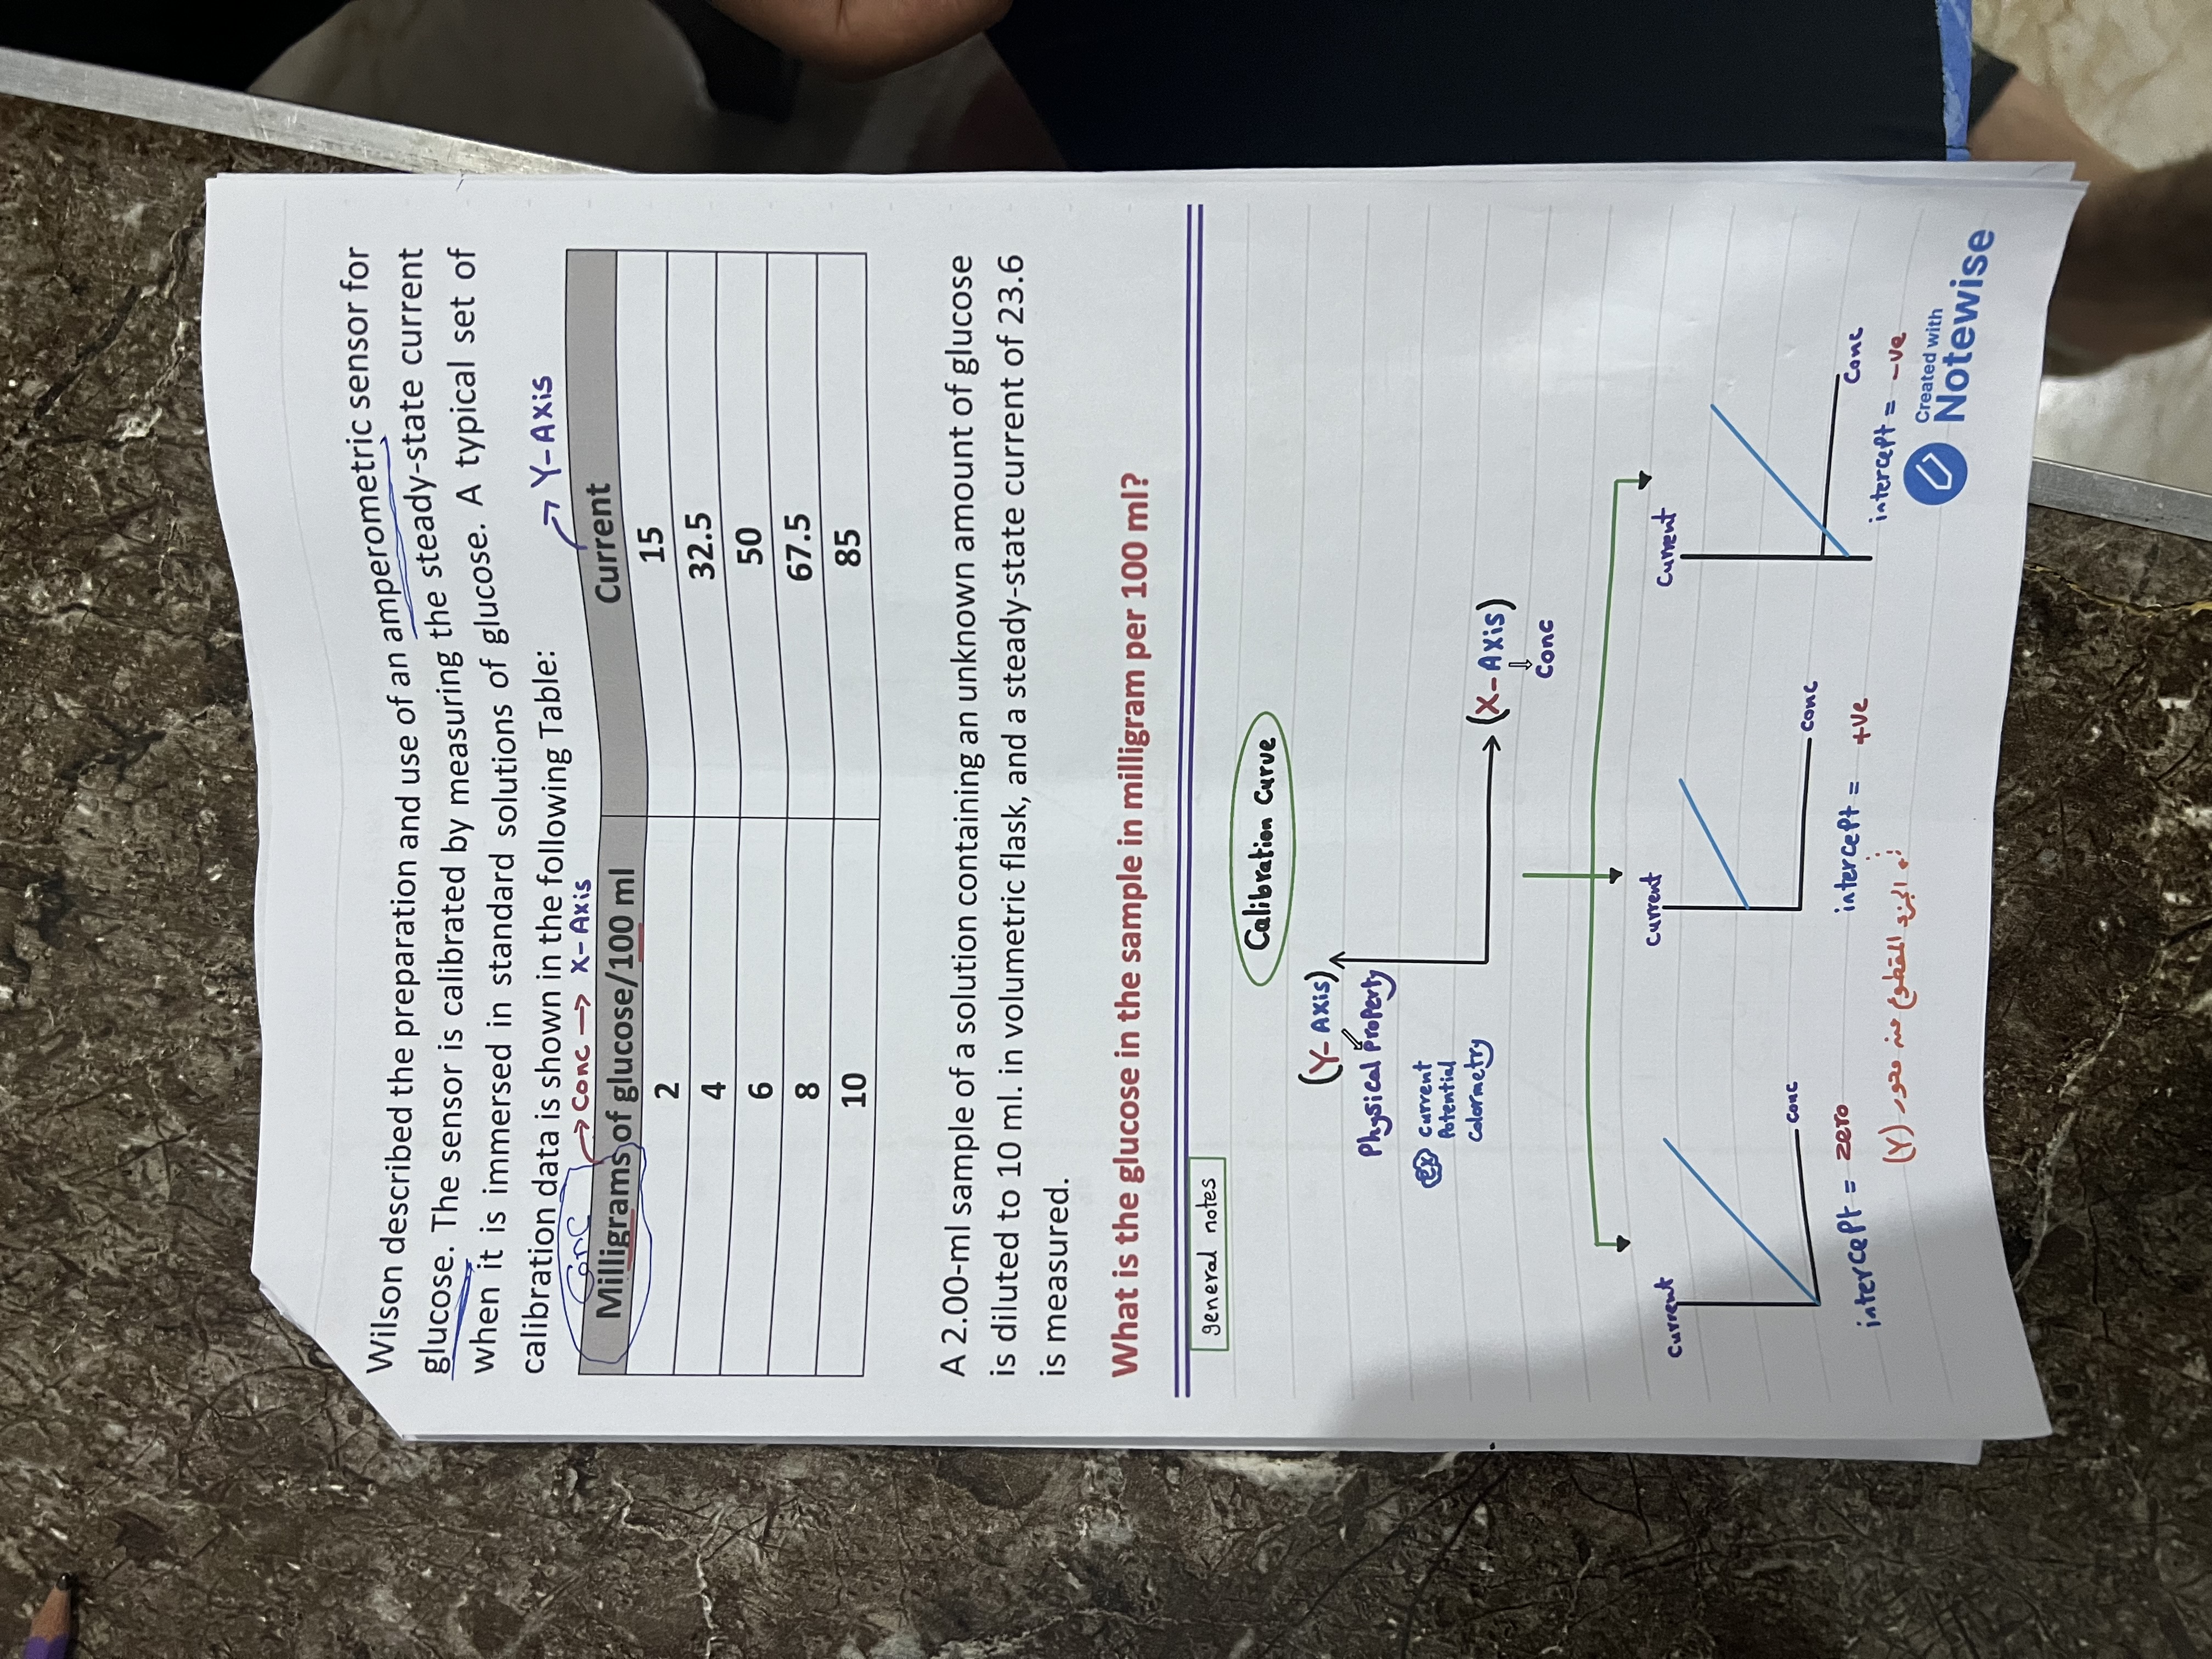
What is the glucose in the sample in milligram per 100 ml?

Understand the Problem
The question is asking for the concentration of glucose in a sample, given a steady-state current measurement and a calibration curve. We need to assess the provided data and use the calibration information to determine the glucose concentration in milligrams per 100 ml.
Answer
$14.85 \text{ mg/100 ml}$
Answer for screen readers
The glucose concentration in the sample is approximately $14.85 \text{ mg/100 ml}$.
Steps to Solve
- Identify the Given Data
We have the steady-state current measurement of the sample, which is 23.6. We also have a calibration curve data as follows:
[ \begin{array}{|c|c|} \hline \text{Milligrams of glucose/100 ml} & \text{Current} \ \hline 2 & 15 \ 4 & 32.5 \ 6 & 50 \ 8 & 67.5 \ 10 & 85 \ \hline \end{array} ]
- Determine the Linear Relationship
To find the relationship between current and glucose concentration, we can use linear regression or observation on the data points. The equation of the line will be in the form:
$$ y = mx + b $$
where ( y ) is the current, ( x ) is the concentration (in mg/100ml), ( m ) is the slope, and ( b ) is the y-intercept.
- Calculate the Slope (m)
Using two data points, for instance, (2, 15) and (10, 85):
[ m = \frac{y_2 - y_1}{x_2 - x_1} = \frac{85 - 15}{10 - 2} = \frac{70}{8} = 8.75 ]
- Determine the y-Intercept (b)
Using one of the points, for example, (2, 15):
[ y = mx + b \implies 15 = 8.75(2) + b \implies b = 15 - 17.5 = -2.5 ]
- Formulate the Equation
Now substituting ( m ) and ( b ) into the linear equation:
[ \text{Current} = 8.75 \times \text{Concentration} - 2.5 ]
- Substitute the Current Value
Now we substitute the measured current (23.6) into the equation to solve for concentration:
[ 23.6 = 8.75 \times \text{Concentration} - 2.5 ]
- Solve for Concentration
Rearranging the equation:
[ 8.75 \times \text{Concentration} = 23.6 + 2.5 = 26.1 ]
Divide both sides by 8.75 to find the concentration:
[ \text{Concentration} = \frac{26.1}{8.75} \approx 2.97 \text{ mg/100 ml} ]
- Adjust for the Dilution Factor
Since the sample was diluted from 2.00 ml to 10 ml, we need to account for this dilution. The dilution factor is:
$$ \text{Dilution Factor} = \frac{10 \text{ ml}}{2 \text{ ml}} = 5 $$
Hence, the concentration in the original solution is:
[ \text{Final Concentration} = 2.97 \times 5 = 14.85 \text{ mg/100 ml} ]
The glucose concentration in the sample is approximately $14.85 \text{ mg/100 ml}$.
More Information
The calibration curve is essential for correlating current readings to glucose concentrations. In this problem, we derived a linear relationship from five data points and accounted for dilution effects on the concentration.
Tips
- Not considering dilution: Failing to multiply by the dilution factor is a common mistake. Always recalculate the concentration based on the original sample volume.
- Error in slope calculation: Ensure that the correct points are chosen and calculations are double-checked.
- Misreading the calibration curve: Make sure to interpret the relationship between current and concentration accurately.
AI-generated content may contain errors. Please verify critical information