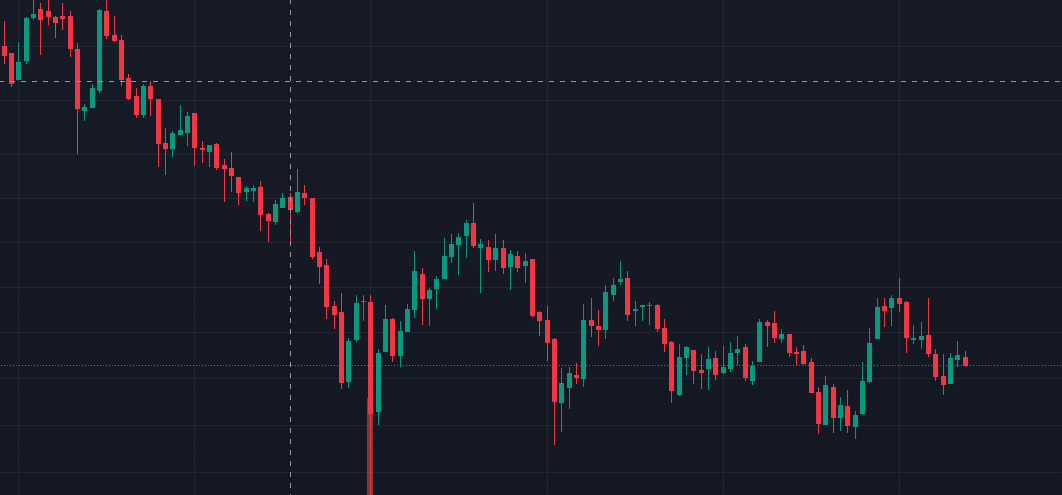
What does this candlestick chart indicate about market trends?

Understand the Problem
The question is asking for an analysis or interpretation of the provided image, which appears to be a candlestick chart commonly used in financial analysis. It's likely seeking insights into market trends or price movements.
Answer
Downward trend with consolidation.
The chart indicates a market with a downward trend initially, followed by some consolidation and potential reversal patterns.
Answer for screen readers
The chart indicates a market with a downward trend initially, followed by some consolidation and potential reversal patterns.
More Information
The initial downward trend is followed by a series of smaller, mixed candlesticks indicating potential price stabilization or consolidation. This might suggest market indecision or a pause in the trend.
Tips
A common mistake is to rely solely on a single candlestick pattern without considering the broader context or trend.
Sources
- Candlestick Patterns: The Updated Guide (2024) - Morpher - morpher.com
- 16 Candlestick Patterns Every Trader Should Know | IG International - ig.com
- Candlestick Charts - CMC Markets - cmcmarkets.com
AI-generated content may contain errors. Please verify critical information