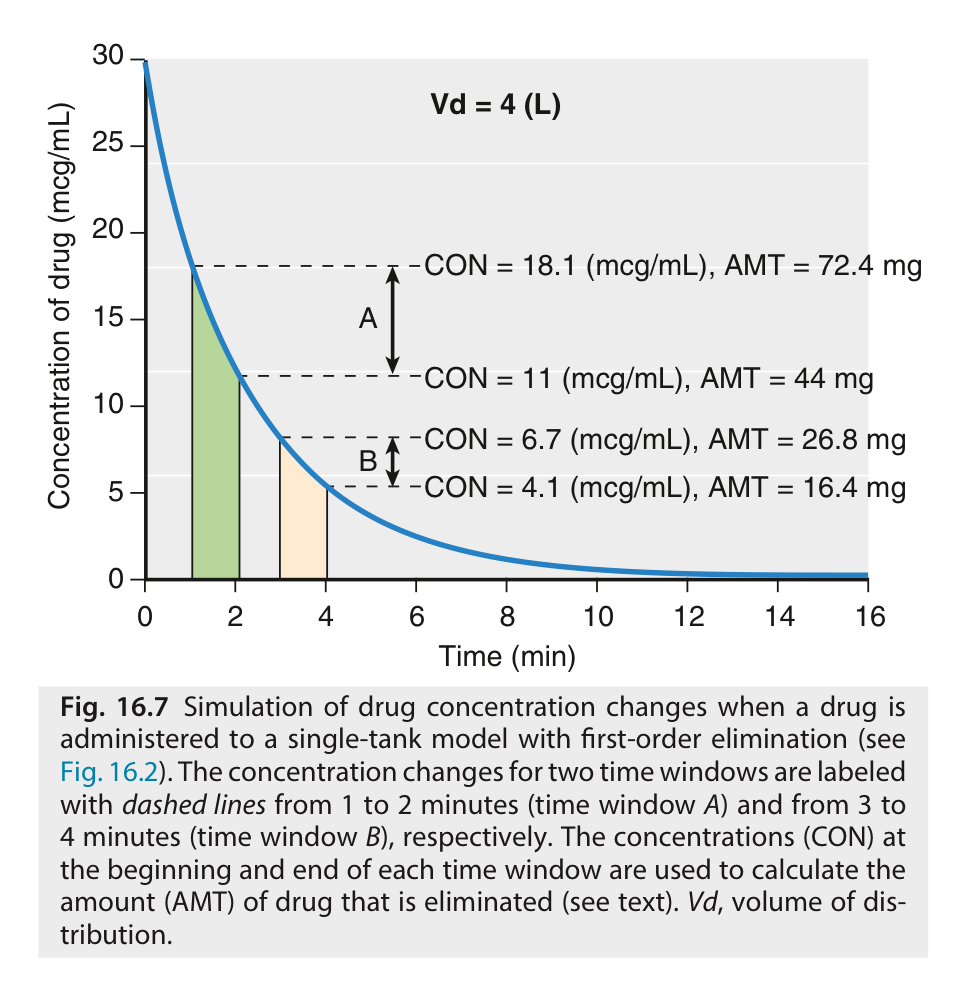
What does the graph indicate regarding the drug concentration changes at time window A and B?

Understand the Problem
The question is analyzing a graph related to drug concentration changes over time, specifically focusing on the areas marked A and B, which correspond to specific time intervals in a drug elimination model. It seeks to understand the relationship between drug concentration, time, and the amount of drug eliminated.
Answer
Concentration decreases in both time windows A and B.
Time window A shows a decrease in concentration from 18.1 mcg/mL to 11 mcg/mL, and time window B decreases from 6.7 mcg/mL to 4.1 mcg/mL.
Answer for screen readers
Time window A shows a decrease in concentration from 18.1 mcg/mL to 11 mcg/mL, and time window B decreases from 6.7 mcg/mL to 4.1 mcg/mL.
More Information
In time window A, the drug concentration decreases by 7.1 mcg/mL. In time window B, it decreases by 2.6 mcg/mL. This illustrates first-order elimination where the rate of elimination is proportional to the concentration.
AI-generated content may contain errors. Please verify critical information