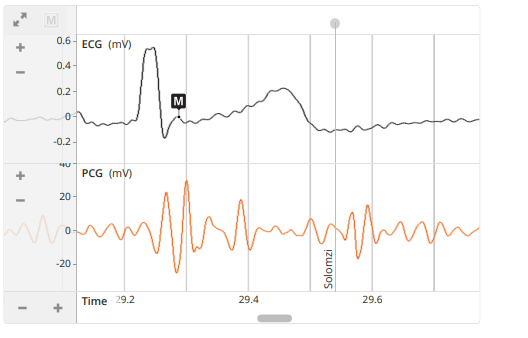
What do the ECG and PCG waveforms indicate, particularly the 'M' point on the ECG and the timing on the PCG?

Understand the Problem
The question is likely related to interpreting the ECG (Electrocardiogram) and PCG (Phonocardiogram) waveforms displayed in the image. The focus could be on understanding the significance of the features highlighted in the waveforms, possibly the 'M' point on the ECG and the timing indicated on the PCG.
Answer
The 'M' point on ECG is the R wave; PCG indicates heart sounds related to valve closures.
The 'M' point on an ECG waveform typically represents the R wave, which is part of the QRS complex indicating ventricular depolarization. Phonocardiography (PCG) aligns these electrical activities with mechanical events, such as heart sounds, associated with valve closures, like the aortic and pulmonary valve closure at the S2 sound.
Answer for screen readers
The 'M' point on an ECG waveform typically represents the R wave, which is part of the QRS complex indicating ventricular depolarization. Phonocardiography (PCG) aligns these electrical activities with mechanical events, such as heart sounds, associated with valve closures, like the aortic and pulmonary valve closure at the S2 sound.
More Information
The ECG measures the heart's electrical activity, including the QRS complex, while the PCG captures the mechanical activity, such as heart sounds. The R wave is crucial for synchronization between electrical and mechanical events.
Tips
A common mistake is confusing the electrical and mechanical events. Remember, ECG is electrical, and PCG is mechanical.
Sources
- Analysis of ECG and PCG Time Delay around Auscultation Sites - scitepress.org
- Phonocardiography - an overview | ScienceDirect Topics - sciencedirect.com
- Comparison of Different Methods for Estimating Cardiac Timings - ncbi.nlm.nih.gov