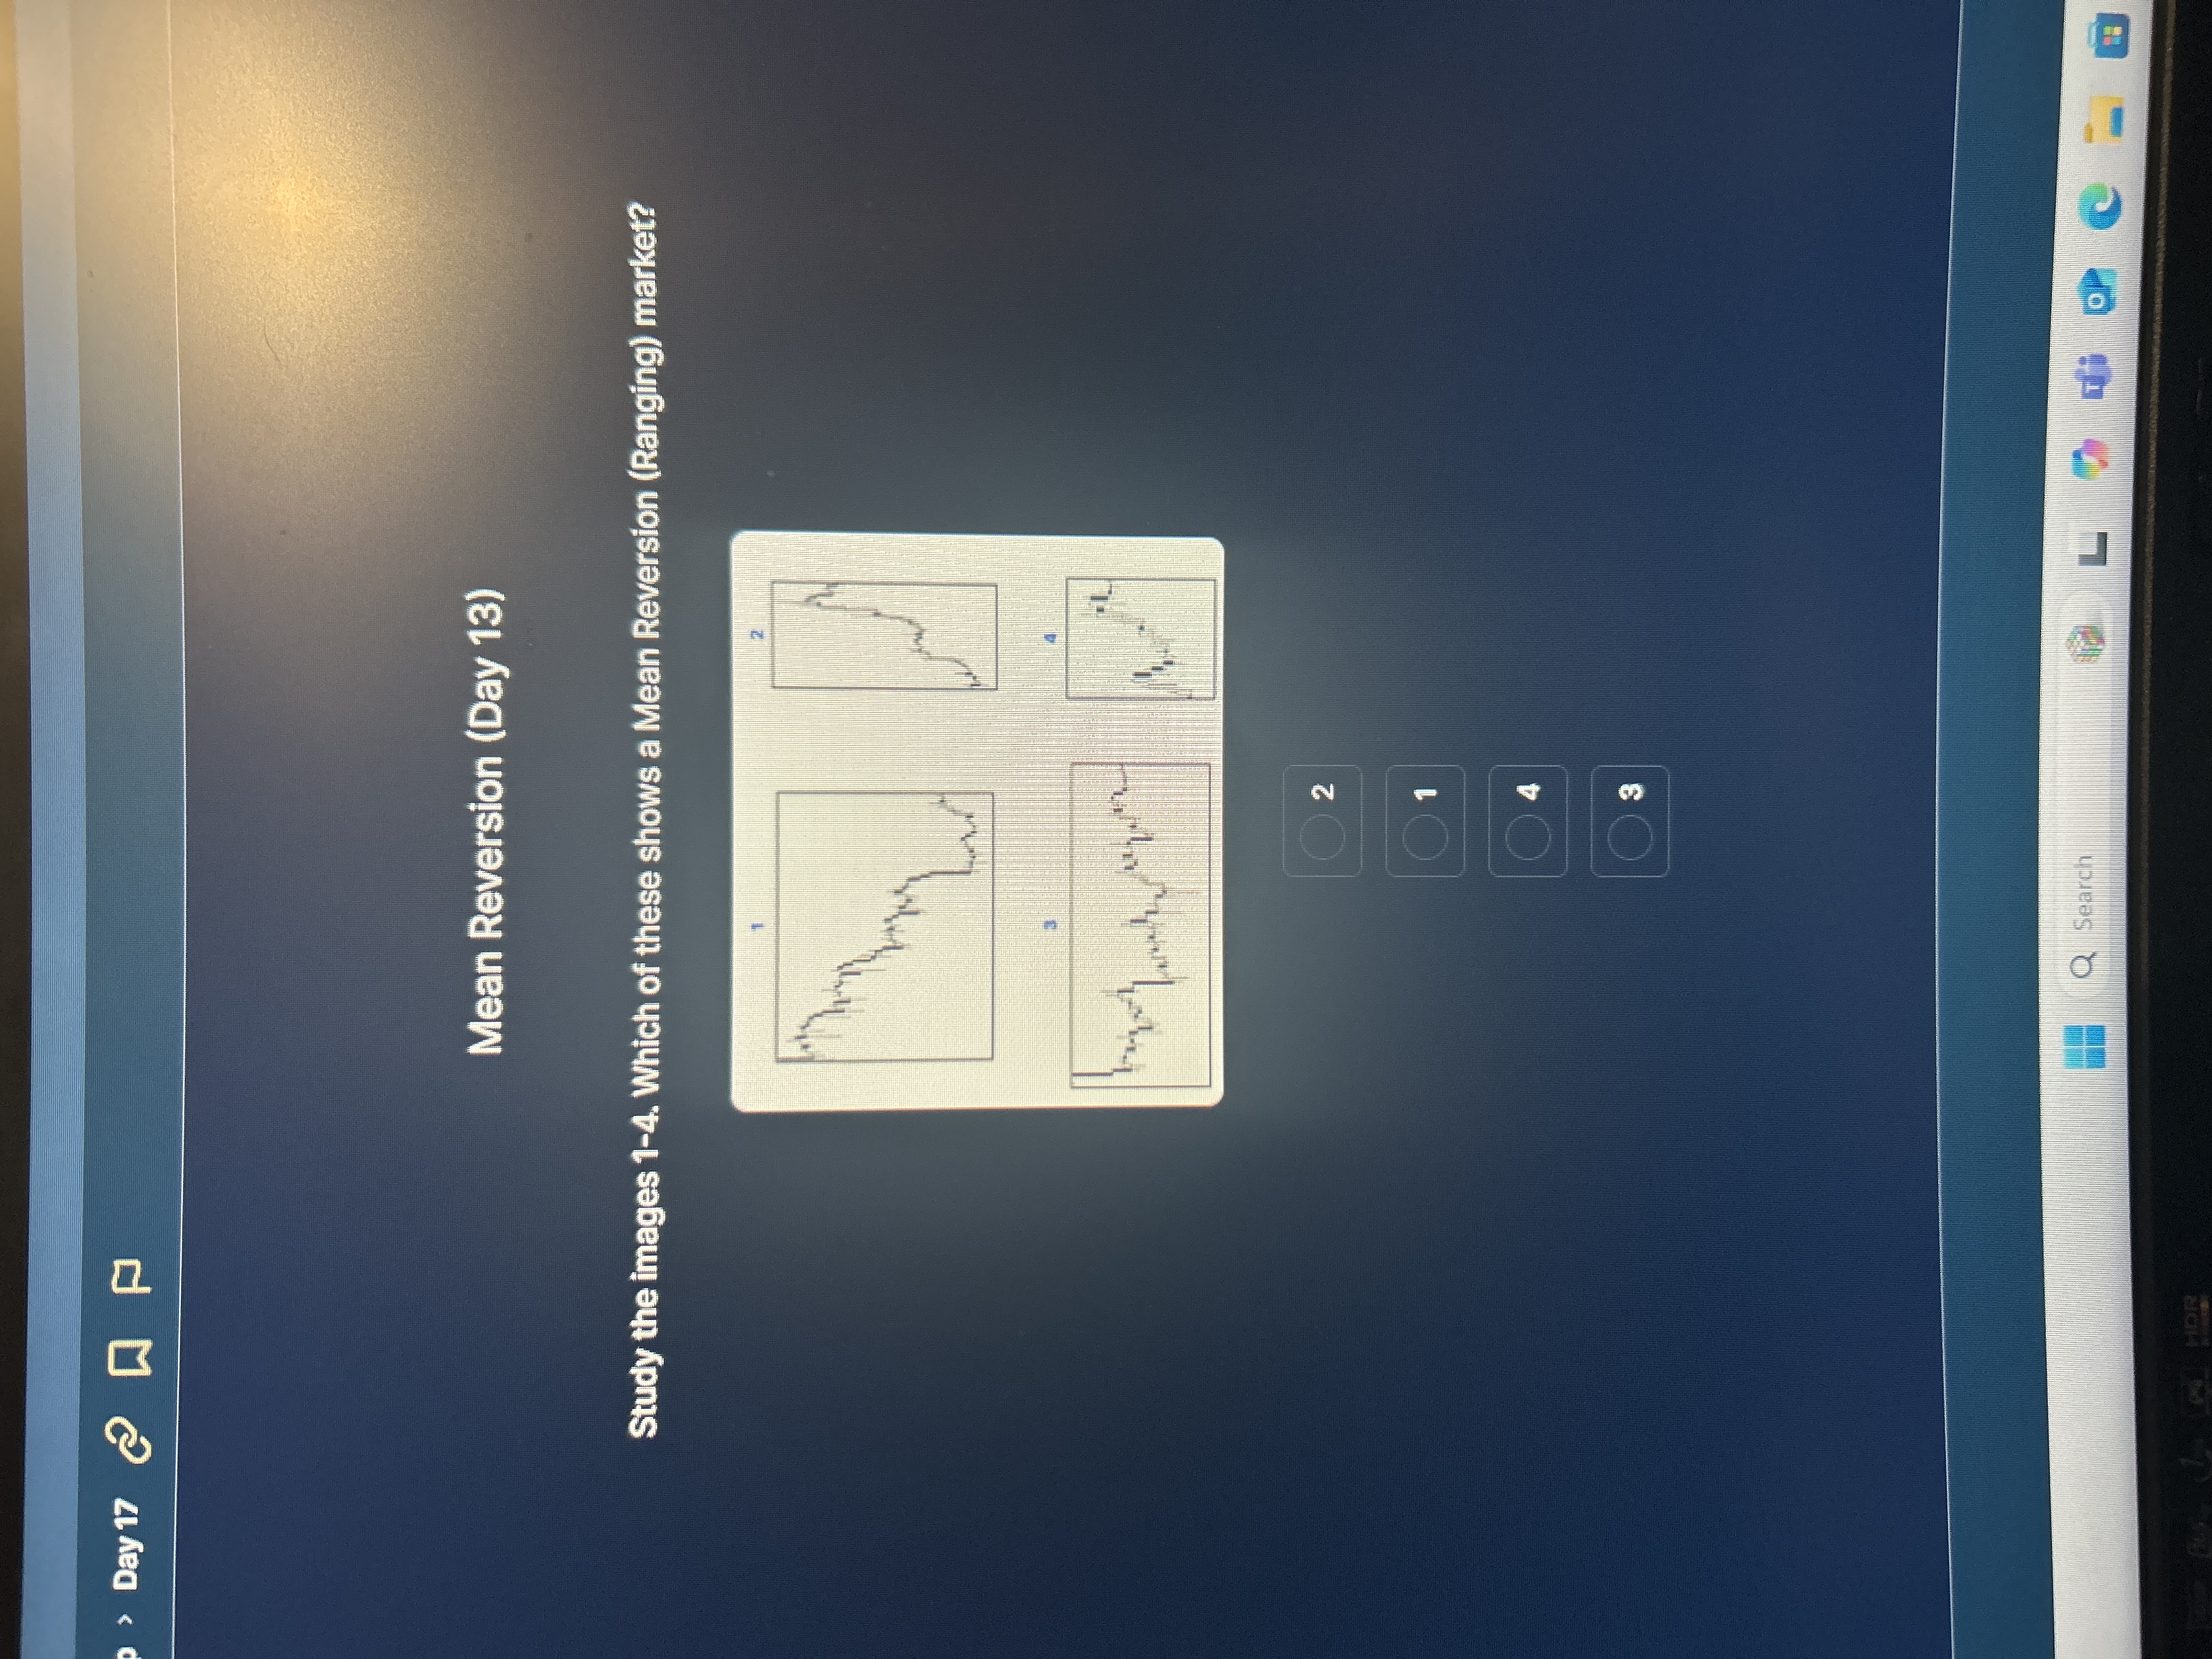
Study the images 1-4. Which of these shows a Mean Reversion (Ranging) market?

Understand the Problem
The question is asking which of the provided images illustrates a Mean Reversion (Ranging) market, requiring analysis of multiple charts to identify the correct one.
Answer
Image 3 shows a Mean Reversion (Ranging) market.
The chart that shows a Mean Reversion (Ranging) market is Image 3.
Answer for screen readers
The chart that shows a Mean Reversion (Ranging) market is Image 3.
More Information
Mean Reversion markets display price movements around a central value, typically appearing as a sideways or ranging pattern without strong trends.
Tips
Common mistakes include confusing trending markets with ranging ones. Look for the absence of a clear upward or downward trend, with prices oscillating around a stable mean.
AI-generated content may contain errors. Please verify critical information