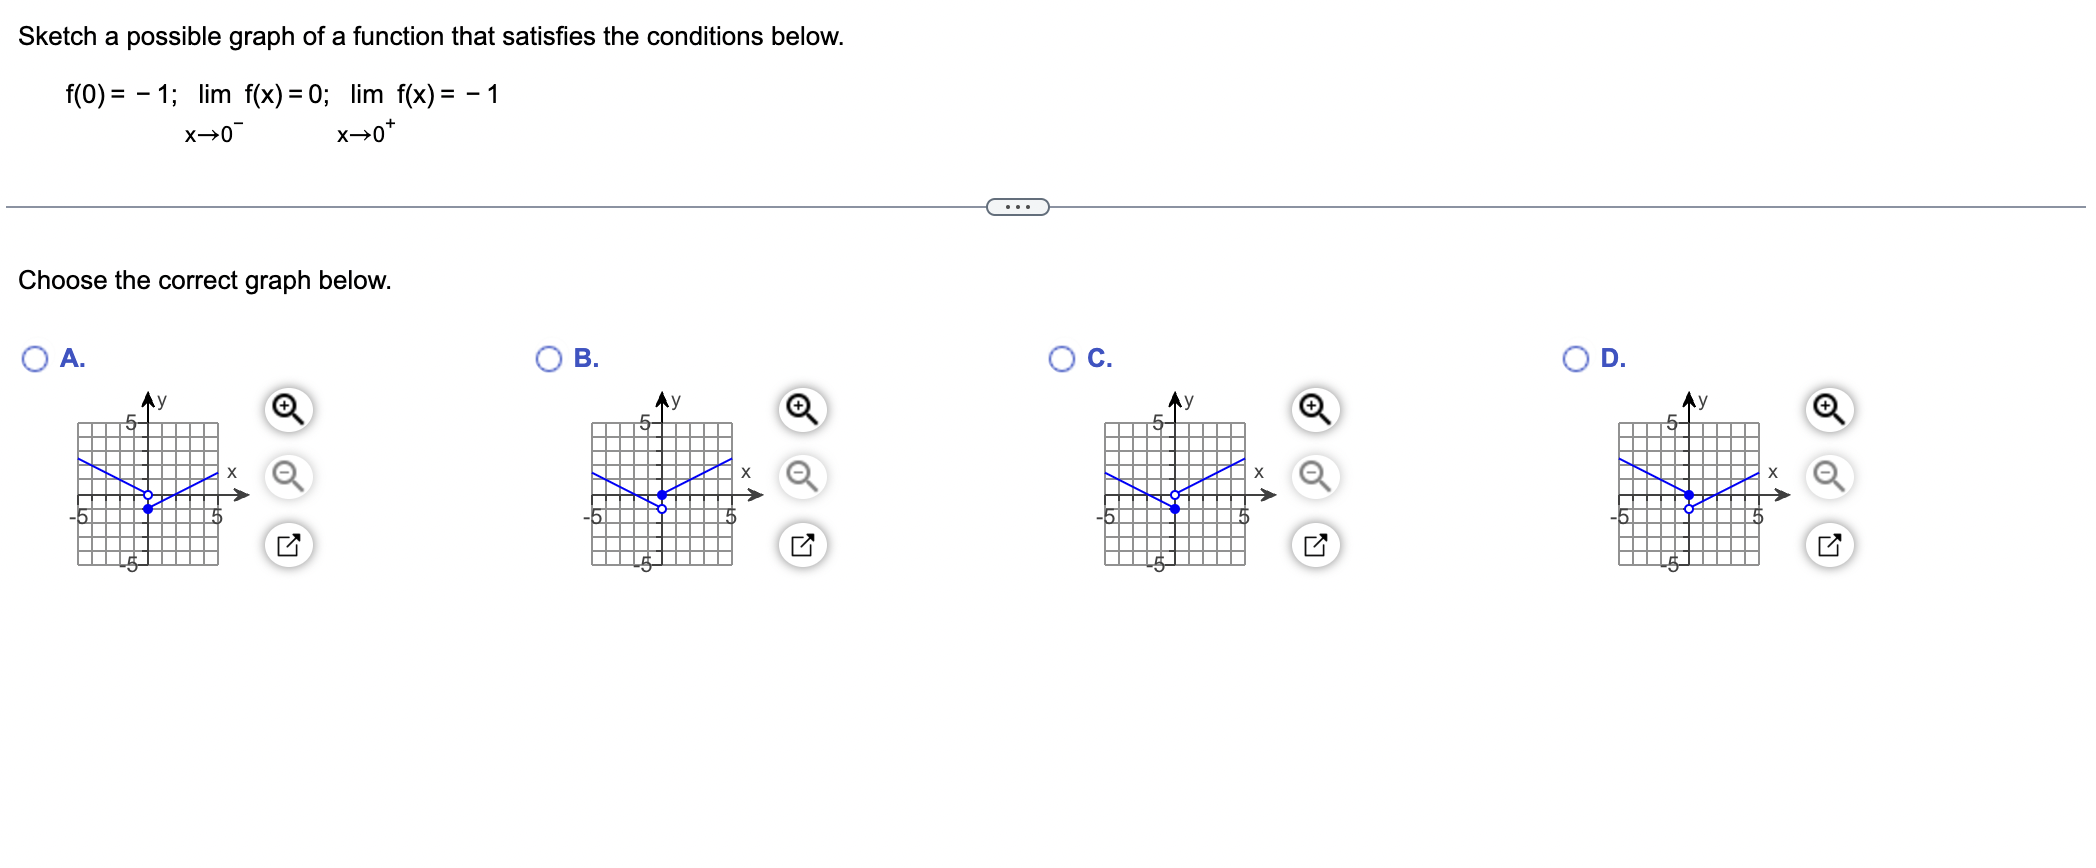
Sketch a possible graph of a function that satisfies the conditions below. f(0) = -1; lim f(x) = 0; lim f(x) = -1.

Understand the Problem
The question is asking the user to sketch a graph of a function based on given conditions related to the function's value at a specific point and its limits approaching that point from both sides. The user must then choose the correct graph representation from the options provided.
Answer
C
Answer for screen readers
The correct graph is C.
Steps to Solve
- Identify the function values at specific points
We know from the problem that
- $f(0) = -1$
- $\lim_{{x \to 0^-}} f(x) = 0$
- $\lim_{{x \to 0^+}} f(x) = -1$
This indicates the function has a hole at $x = 0$ and approaches two different values from the left and right.
- Analyze the left-hand limit
The left-hand limit $\lim_{{x \to 0^-}} f(x) = 0$ means that as $x$ approaches 0 from the left, $f(x)$ should approach 0. Therefore, for values of $x < 0$, the function should be heading towards the point (just before 0 on the y-axis, which is the point (0,0) but not including it).
- Analyze the right-hand limit
The right-hand limit $\lim_{{x \to 0^+}} f(x) = -1$ indicates that as $x$ approaches 0 from the right, the function approaches -1. So for values of $x > 0$, the graph will be near the point (0, -1).
- Sketch key points
- At $x = 0$, place a point for $f(0) = -1$. This should be a solid dot at (0, -1).
- As $x$ approaches 0 from the left, the graph must go up towards (0, 0) but without actually touching it (indicating a hole).
- As $x$ approaches 0 from the right, the graph should start from (0, -1) downwards (solid point).
- Choose the graph
Compare the drawn characteristics to the provided graph options A, B, C, and D. Choose the one that shows the described behavior.
The correct graph is C.
More Information
Graph C shows a hole at (0, 0) since $f(0) = -1$, a solid point at (0, -1) to reflect the actual function value, and follows the limit conditions appropriately from both sides.
Tips
- Not recognizing that the value at 0 does not match the left-hand limit, leading to incorrect drawing of the graph.
- Confusing where the function should go when approaching the limits from either side.
AI-generated content may contain errors. Please verify critical information