Understand the Problem
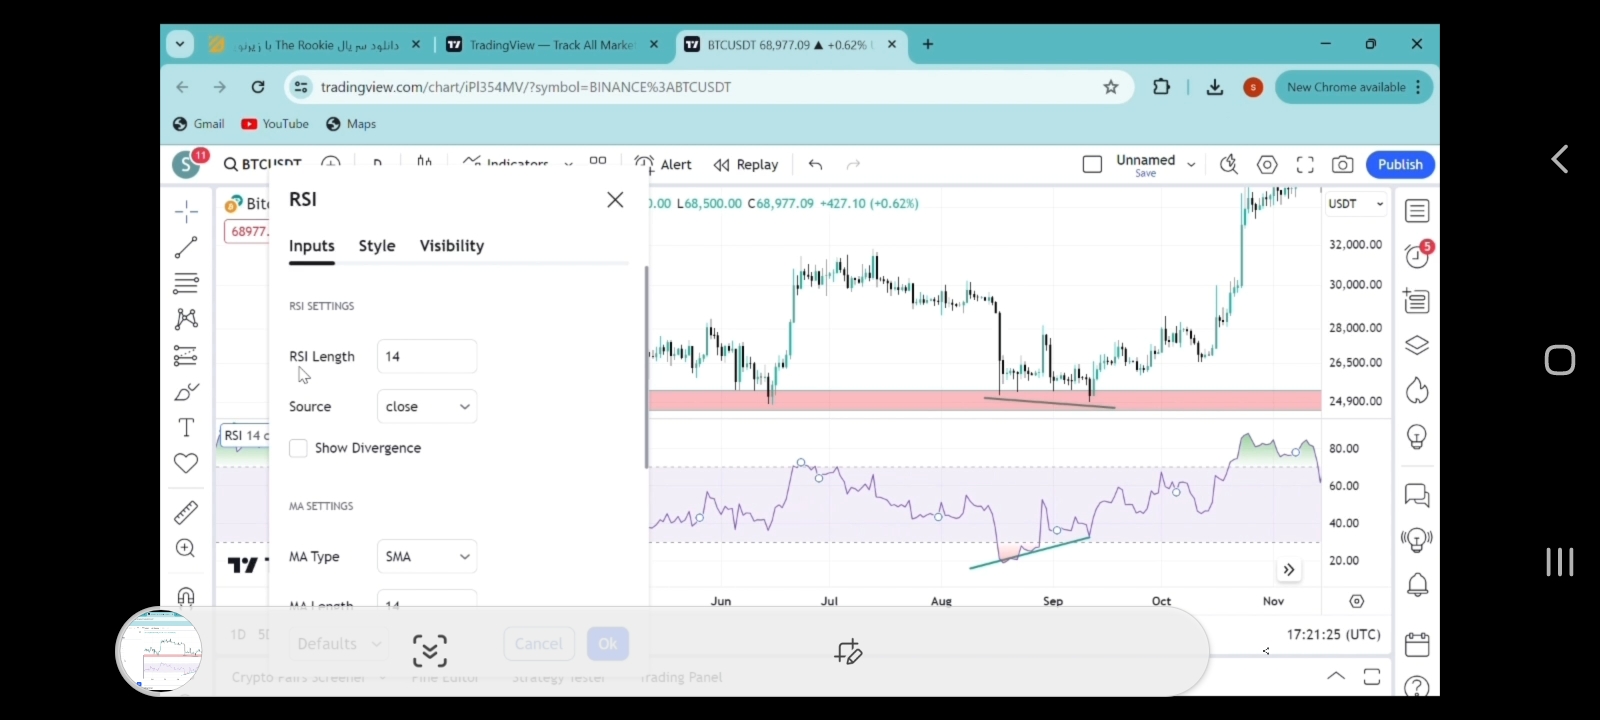
The question seems to relate to the RSI (Relative Strength Index) settings in a charting tool, potentially asking for guidance or clarification on how to use or interpret these settings. Specifically, it appears to focus on parameters such as the RSI length and other configuration options.
Answer
TradingView chart of Bitcoin with RSI and divergence.
The image shows a TradingView chart for Bitcoin (BTC) with an RSI indicator setup. The RSI length is 14, source is 'close,' and it includes a divergence displayed on the chart, highlighting potential bullish signals.
Answer for screen readers
The image shows a TradingView chart for Bitcoin (BTC) with an RSI indicator setup. The RSI length is 14, source is 'close,' and it includes a divergence displayed on the chart, highlighting potential bullish signals.
More Information
The RSI (Relative Strength Index) is a momentum indicator used to identify overbought or oversold conditions in a market. Divergences between price action and RSI can signal potential trend reversals.
Tips
Avoid relying solely on RSI; use it with other indicators for better accuracy.
AI-generated content may contain errors. Please verify critical information