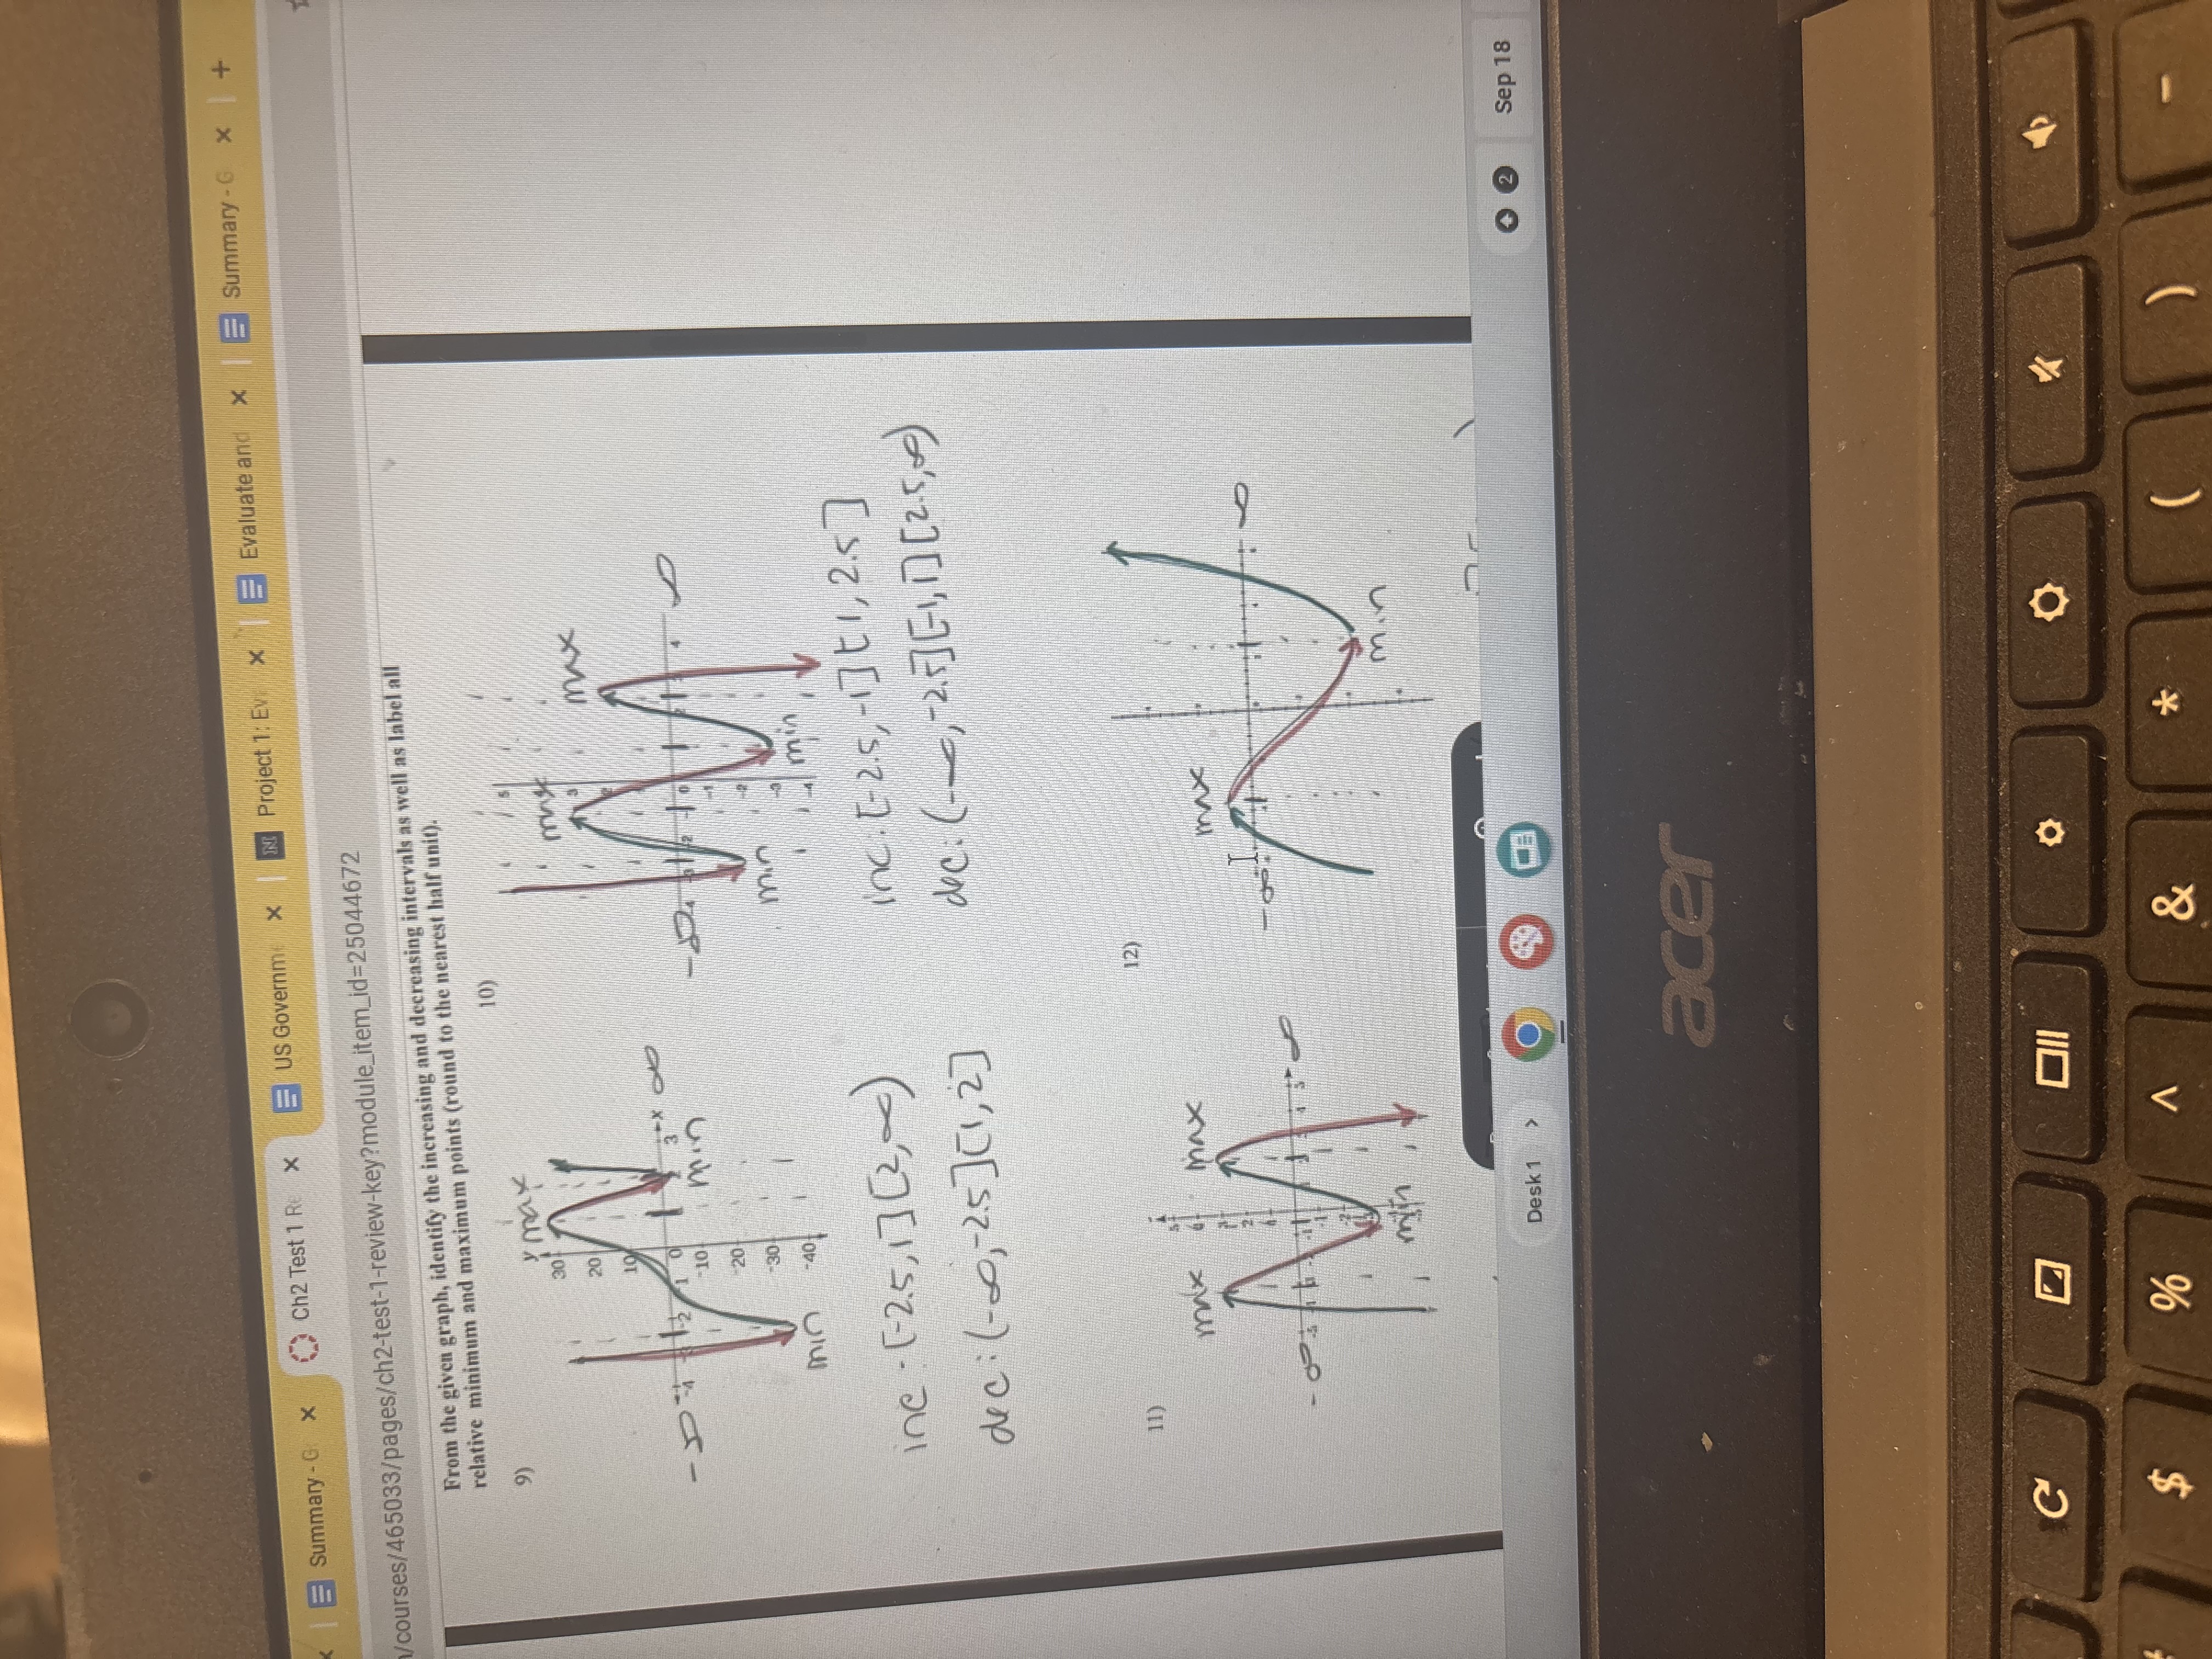
From the given graph, identify the increasing and decreasing intervals as well as label all relative minimum and maximum points (round to the nearest half unit).

Understand the Problem
The question is asking to identify the increasing and decreasing intervals of the functions depicted in the given graphs, as well as to label all relative minimum and maximum points, rounding to the nearest half unit.
Answer
Graph 9: inc: $(-2.5, 1) \cup (2, \infty)$, dec: $(-\infty, -2.5) \cup (1, 2)$; min: $(1, -20)$, max: $(-2.5, 15)$. Graph 10: inc: $(2.5, 5)$, dec: $(-\infty, 2) \cup (5, \infty)$; min: $(1, 0)$, max: $(1.5, 3)$.
Answer for screen readers
For Graph 9:
- Increasing intervals: $(-2.5, 1) \cup (2, \infty)$
- Decreasing intervals: $(-\infty, -2.5) \cup (1, 2)$
- Relative minimum: $(1, -20)$
- Relative maximum: $(-2.5, 15)$
For Graph 10:
- Increasing intervals: $(2.5, 5)$
- Decreasing intervals: $(-\infty, 2) \cup (5, \infty)$
- Relative minimum: $(1, 0)$
- Relative maximum: $(1.5, 3)$
Steps to Solve
-
Identify Increasing Intervals Examine the graphs to determine where the function is going up. For example, if the function values increase as you move from left to right, that section is labeled as increasing.
-
Identify Decreasing Intervals Look for segments of the graph where the function goes down. If the function values decrease as you move from left to right, mark that section as decreasing.
-
Label Relative Minimum Points Find points in the graph where the function changes from decreasing to increasing; this is usually where the function attains its lowest value in a local region. Record these points as relative minimums, rounding them to the nearest half unit.
-
Label Relative Maximum Points Similarly, locate points where the function changes from increasing to decreasing; these are the local highest points. Note these points as relative maximums, rounding them to the nearest half unit.
-
Check for End Behavior For both graphs, observe how the function behaves as you approach the edges (left and right). This can provide context for the intervals you've identified.
For Graph 9:
- Increasing intervals: $(-2.5, 1) \cup (2, \infty)$
- Decreasing intervals: $(-\infty, -2.5) \cup (1, 2)$
- Relative minimum: $(1, -20)$
- Relative maximum: $(-2.5, 15)$
For Graph 10:
- Increasing intervals: $(2.5, 5)$
- Decreasing intervals: $(-\infty, 2) \cup (5, \infty)$
- Relative minimum: $(1, 0)$
- Relative maximum: $(1.5, 3)$
More Information
Identifying increasing and decreasing intervals is crucial for understanding the behavior of functions. Relative extrema help indicate points where a function is at its highest or lowest, which is useful in applications such as optimization.
Tips
- Ignoring endpoints: Ensure you note whether the intervals are open or closed based on whether the function includes those points.
- Misidentifying increasing/decreasing regions: Always ensure you observe the change in function direction carefully.
AI-generated content may contain errors. Please verify critical information