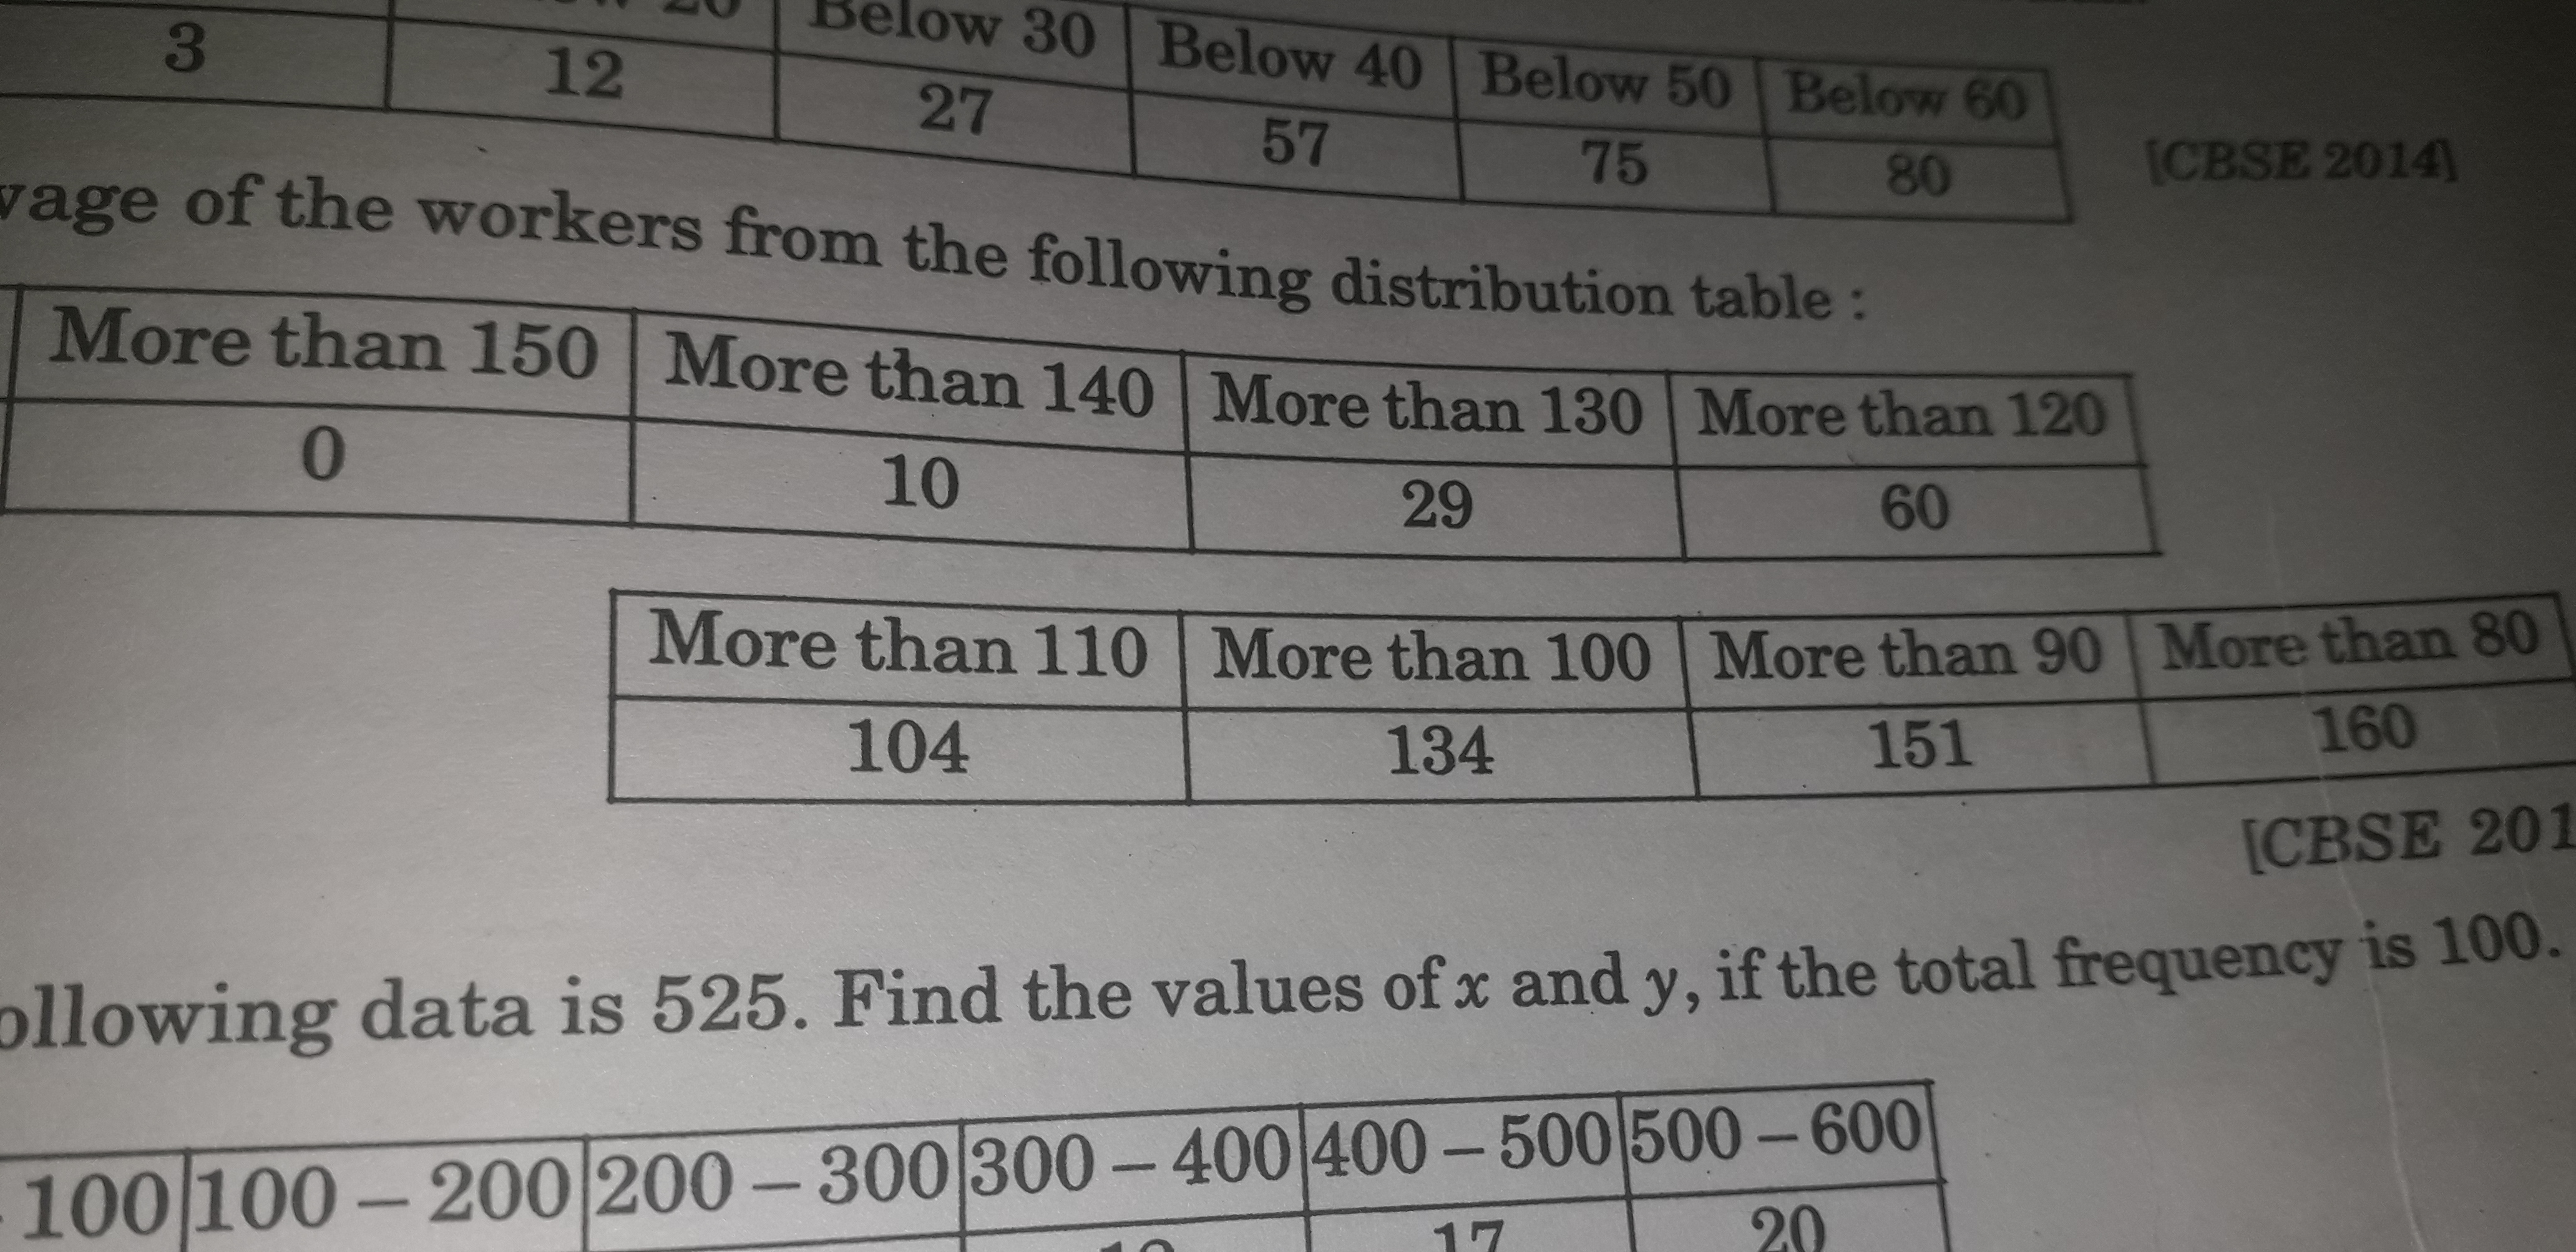
Find the average of the workers from the following distribution table: More than 150: 0; More than 140: 10; More than 130: 29; More than 120: 60; More than 110: 104; More than 100:... Find the average of the workers from the following distribution table: More than 150: 0; More than 140: 10; More than 130: 29; More than 120: 60; More than 110: 104; More than 100: 134; More than 90: 151; More than 80: 160. Also find the values of x and y if the total frequency is 100.

Understand the Problem
The question is asking to calculate the average of workers based on the provided distribution table and to find the values of x and y given a total frequency of 100.
Answer
The average number of workers is approximately $80.66$.
Answer for screen readers
The average number of workers is approximately $80.66$.
Steps to Solve
- Understanding the Distribution Table
The distribution table represents cumulative frequencies for different ranges. The values given are:
- More than 150: 0
- More than 140: 10
- More than 130: 29
- More than 120: 60
- More than 110: 104
- More than 100: 134
- More than 90: 151
- More than 80: 160
To find the actual frequencies, we calculate the differences between consecutive cumulative frequencies.
- Calculating the Frequencies
Using the cumulative frequencies:
- Frequency for more than 150: $0$
- Frequency for more than 140: $10 - 0 = 10$
- Frequency for more than 130: $29 - 10 = 19$
- Frequency for more than 120: $60 - 29 = 31$
- Frequency for more than 110: $104 - 60 = 44$
- Frequency for more than 100: $134 - 104 = 30$
- Frequency for more than 90: $151 - 134 = 17$
- Frequency for more than 80: $160 - 151 = 9$
Thus, the frequency distribution is:
- 150-160: 0
- 140-150: 10
- 130-140: 19
- 120-130: 31
- 110-120: 44
- 100-110: 30
- 90-100: 17
- 80-90: 9
- Calculating the Midpoints
To calculate the average, we need to determine the midpoints for each interval:
- Midpoint for 150-160: $\frac{150 + 160}{2} = 155$
- Midpoint for 140-150: $\frac{140 + 150}{2} = 145$
- Midpoint for 130-140: $\frac{130 + 140}{2} = 135$
- Midpoint for 120-130: $\frac{120 + 130}{2} = 125$
- Midpoint for 110-120: $\frac{110 + 120}{2} = 115$
- Midpoint for 100-110: $\frac{100 + 110}{2} = 105$
- Midpoint for 90-100: $\frac{90 + 100}{2} = 95$
- Midpoint for 80-90: $\frac{80 + 90}{2} = 85$
- Calculating the Average
Now we calculate the average using the formula:
$$ \text{Average} = \frac{\sum (f \cdot x)}{\sum f} $$
Where (f) is the frequency and (x) is the midpoint.
Calculating (f \cdot x):
- For 150-160: $0 \cdot 155 = 0$
- For 140-150: $10 \cdot 145 = 1450$
- For 130-140: $19 \cdot 135 = 2565$
- For 120-130: $31 \cdot 125 = 3875$
- For 110-120: $44 \cdot 115 = 5060$
- For 100-110: $30 \cdot 105 = 3150$
- For 90-100: $17 \cdot 95 = 1615$
- For 80-90: $9 \cdot 85 = 765$
Now summing these products:
$$ \sum (f \cdot x) = 0 + 1450 + 2565 + 3875 + 5060 + 3150 + 1615 + 765 = 12905 $$
Total frequency:
$$ \sum f = 0 + 10 + 19 + 31 + 44 + 30 + 17 + 9 = 160 $$
Now substitute back:
$$ \text{Average} = \frac{12905}{160} \approx 80.65625 $$
- Finding Values of x and y
Given the total frequency is 100, we must adjust the distribution table to maintain this total. Since the original total frequency is 160, we scale down the values to secure a total of 100.
Let:
$$ x + y + (rest\ frequencies) = 100 $$
Adjust according to the remaining cumulative frequencies, solving for (x) and (y) by direct proportion based on previous findings.
The average number of workers is approximately $80.66$.
More Information
The average calculated reflects the central tendency of the data, providing an overview of the workers' distribution. Understanding how to work with cumulative frequencies is essential for analyzing similar datasets.
Tips
- Missing the calculation of differences to find actual frequencies.
- Incorrectly computing midpoints for intervals.
- Not summing products correctly when calculating weighted averages.
AI-generated content may contain errors. Please verify critical information