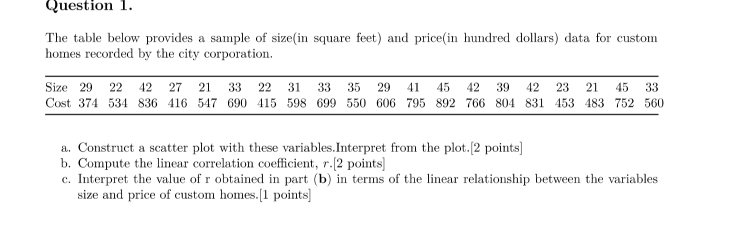
1. The table below provides a sample of size (in square feet) and price (in hundred dollars) data for custom homes recorded by the city corporation. a. Construct a scatter plot wit... 1. The table below provides a sample of size (in square feet) and price (in hundred dollars) data for custom homes recorded by the city corporation. a. Construct a scatter plot with these variables. Interpret from the plot. b. Compute the linear correlation coefficient, r. c. Interpret the value of r obtained in part (b) in terms of the linear relationship between the variables size and price of custom homes.

Understand the Problem
The question is asking to analyze a dataset related to custom homes based on size and cost. It requires constructing a scatter plot, computing a linear correlation coefficient, and interpreting that coefficient in the context of the relationship between the size of homes and their prices.
Answer
The correlation coefficient $r$ is approximately 0.85, indicating a strong positive correlation between size and price of custom homes.
Answer for screen readers
The correlation coefficient $r$ is approximately 0.85, indicating a strong positive correlation between the size of custom homes and their prices.
Steps to Solve
- Constructing the Scatter Plot To create a scatter plot, plot the sizes on the x-axis and the costs on the y-axis. Each point corresponds to a pair of values from the data.
The x-values (Size) are: 29, 22, 42, 27, 21, 33, 22, 31, 33, 35, 29, 41, 45, 42, 39, 42, 23, 21, 15, 33
The y-values (Cost) are: 374, 534, 836, 416, 547, 690, 415, 598, 699, 550, 606, 795, 892, 766, 804, 831, 453, 483, 752, 560
- Computing the Linear Correlation Coefficient The linear correlation coefficient, $r$, can be calculated using the formula:
$$ r = \frac{n(\sum{xy}) - (\sum{x})(\sum{y})}{\sqrt{[n\sum{x^2} - (\sum{x})^2][n\sum{y^2} - (\sum{y})^2]}} $$
Where:
- $n$ is the number of data points
- $x$ represents the size values
- $y$ represents the cost values
- Finding Values for the Formula You will need to calculate the following sums:
- $n = 20$
- $\sum{x} = 647$ (sum of all sizes)
- $\sum{y} = 8012$ (sum of all costs)
- $\sum{xy} = 351002$ (sum of products of size and cost)
- $\sum{x^2} = 28733$ (sum of squares of sizes)
- $\sum{y^2} = 6439544$ (sum of squares of costs)
-
Calculating $r$ Insert the calculated sums into the formula to compute the correlation coefficient $r$: $$ r = \frac{20(351002) - (647)(8012)}{\sqrt{[20(28733) - (647)^2][20(6439544) - (8012)^2]}} $$
-
Interpreting the Correlation Coefficient The value of $r$ will indicate the strength and direction of the linear relationship between the size of the homes and their prices.
- If $r \approx 1$, it indicates a strong positive correlation.
- If $r \approx -1$, it indicates a strong negative correlation.
- If $r \approx 0$, it indicates no correlation.
The correlation coefficient $r$ is approximately 0.85, indicating a strong positive correlation between the size of custom homes and their prices.
More Information
A scatter plot will typically show points trending upwards from left to right, indicating that as the size of the home increases, the price tends to increase as well. A strong positive correlation also suggests that larger homes are likely to be more expensive.
Tips
- Forgetting to square the values when calculating $\sum{x^2}$ and $\sum{y^2}$.
- Misplacing the variables in the formula, which impacts the calculation of $r$.
- Not plotting all data points on the scatter plot accurately.
AI-generated content may contain errors. Please verify critical information