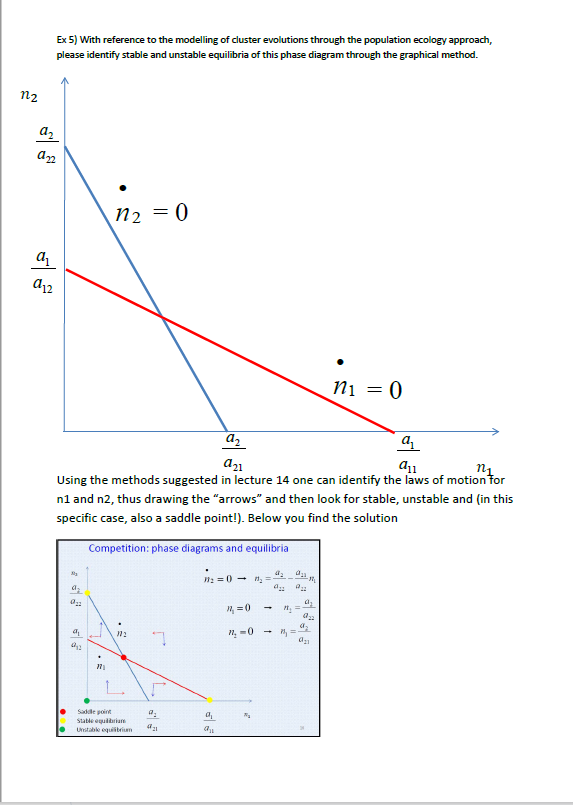
With reference to the modeling of cluster evolutions through the population ecology approach, please identify stable and unstable equilibria of this phase diagram through the graph... With reference to the modeling of cluster evolutions through the population ecology approach, please identify stable and unstable equilibria of this phase diagram through the graphical method.

Understand the Problem
The question asks for the identification of stable and unstable equilibria in a phase diagram related to population ecology, using graphical methods as referenced in lecture 14.
Answer
Stable and unstable equilibria at different intersection points on the phase diagram.
The phase diagram shows a stable equilibrium at one intersection and an unstable equilibrium with a saddle point nature at another.
Answer for screen readers
The phase diagram shows a stable equilibrium at one intersection and an unstable equilibrium with a saddle point nature at another.
More Information
Stable equilibrium points tend to return to equilibrium after small disturbances, while unstable points diverge. Saddle points aren't stable in either direction.
Tips
Common mistakes include misidentifying equilibrium points without analyzing the direction of surrounding trajectories. Always check the flow of arrows relative to equilibrium points.
Sources
- The model has equilibrium points | Chegg.com - chegg.com
- Model for population growth and finding the equilibrium solutions - math.stackexchange.com
AI-generated content may contain errors. Please verify critical information