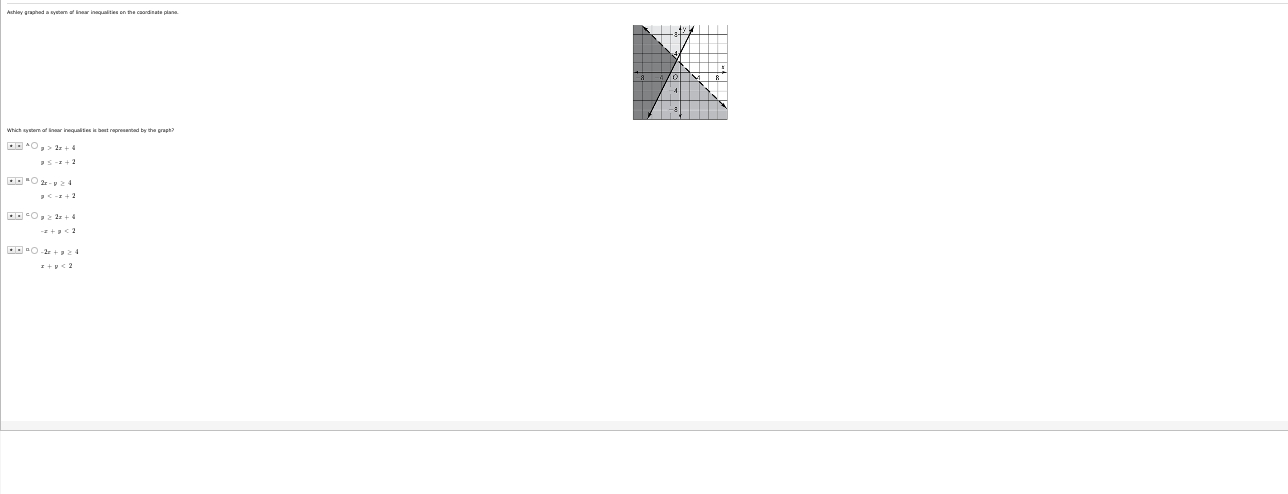
Which system of linear inequalities is best represented by the graph?

Understand the Problem
The question is asking which system of linear inequalities corresponds to the graphical representation shown in the attached image. To solve this, we will need to analyze the graph and determine the inequalities that describe its boundaries.
Answer
The system of inequalities is \( y > -\frac{1}{2}x + 4, \, y \leq -x + 2, \, y < 2 \).
Answer for screen readers
The correct system of linear inequalities representing the graph is:
- ( y > -\frac{1}{2}x + 4 )
- ( y \leq -x + 2 )
- ( y < 2 )
Steps to Solve
- Identify Boundaries in the Graph
Observe the lines in the graph to determine the equations of the boundaries. Note the points where the lines intersect the axes.
- Determine the Inequalities
For each line equation, decide whether the region described by the inequality is above or below the line. This can be deduced from the shaded region.
- Write the Line Equations
Based on the identified boundaries, the equations of the lines can be written. For example, if a line crosses the y-axis at 2 and has a slope of -1, the equation would be $y < -x + 2$.
- Combine the Inequalities
Combine the inequalities that correspond to each boundary line. Ensure the combined inequalities represent the entire shaded region in the graph.
- Match with Given Options
Compare the derived system of inequalities with the options provided to determine which one matches your findings.
The correct system of linear inequalities representing the graph is:
- ( y > -\frac{1}{2}x + 4 )
- ( y \leq -x + 2 )
- ( y < 2 )
More Information
The answer indicates the relationships between the lines and the shaded regions they define. The first inequality represents a region above the line, while the second represents a region below or along another line, and the last constrains y-values.
Tips
- Misidentifying which region (above or below) corresponds to each line. To avoid this, carefully assess the shading direction.
- Incorrectly combining inequalities. Ensure that you thoroughly check each line equation aligns with the edge of the shaded area in the graph.
AI-generated content may contain errors. Please verify critical information