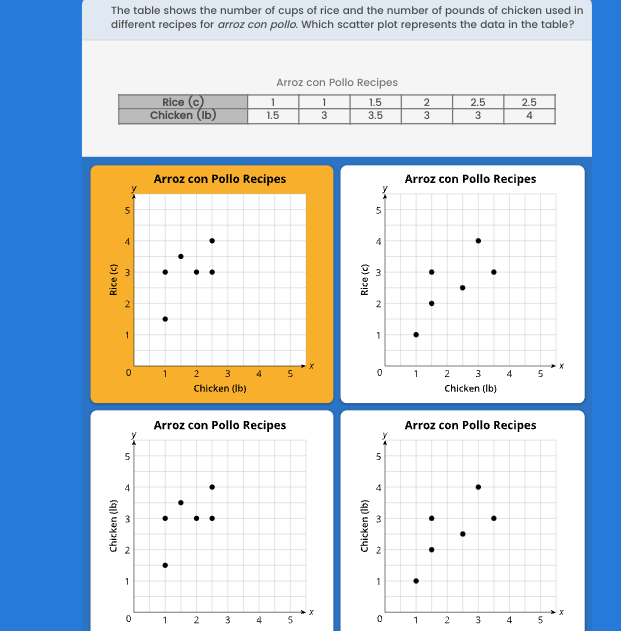
Which scatter plot represents the data in the table for arroz con pollo recipes?

Understand the Problem
The question is asking which scatter plot accurately represents the relationship between the number of cups of rice and pounds of chicken used in different recipes for arroz con pollo, based on the data provided in the table.
Answer
The scatter plot that accurately represents the data is the one showing the points (1, 1.5), (1, 3), (1.5, 3.5), (2, 3), and (2.5, 4).
Answer for screen readers
The correct scatter plot is the one that shows the following points correctly:
- (1, 1.5)
- (1, 3)
- (1.5, 3.5)
- (2, 3)
- (2.5, 4)
Steps to Solve
- Understanding the Data Table
First, we need to extract the data from the table:
- Cups of Rice: $1, 1, 1.5, 2, 2.5$
- Pounds of Chicken: $1.5, 3, 3.5, 3, 4$
- Pairing Data Points
Next, we can create coordinated pairs based on their respective values of rice and chicken:
- (1, 1.5)
- (1, 3)
- (1.5, 3.5)
- (2, 3)
- (2.5, 4)
- Plotting Points on the Scatter Plot
Now we can plot these pairs on a scatter plot. The x-axis will represent chicken (in pounds) and the y-axis will represent rice (in cups). The points to plot are:
- (1, 1.5)
- (1, 3)
- (1.5, 3.5)
- (2, 3)
- (2.5, 4)
- Identifying the Correct Scatter Plot
Observe the scatter plots provided. The correct plot should show the exact positions of the points plotted.
By comparing the 5 pairs of coordinates to the scatter plots, we can identify the accurate representation.
The correct scatter plot is the one that shows the following points correctly:
- (1, 1.5)
- (1, 3)
- (1.5, 3.5)
- (2, 3)
- (2.5, 4)
More Information
The scatter plot visually represents the relationship between the amount of rice and chicken used in recipes. Analyzing scatter plots can help identify trends, correlations, or patterns in the data.
Tips
- Not carefully plotting the points according to the data.
- Mixing up the axes; ensure that chicken (pounds) is on the x-axis and rice (cups) is on the y-axis.
- Ignoring duplicates in x or y values which may lead to plotting errors.
AI-generated content may contain errors. Please verify critical information