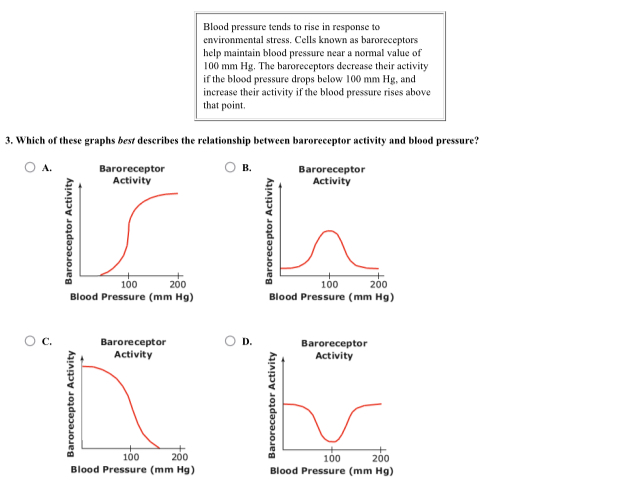
Which of these graphs best describes the relationship between baroreceptor activity and blood pressure?

Understand the Problem
The question is asking to identify which graph best represents the relationship between baroreceptor activity and blood pressure based on physiological principles. It requires an understanding of how baroreceptors function in response to changes in blood pressure.
Answer
Graph A.
The final answer is graph A.
Answer for screen readers
The final answer is graph A.
More Information
Baroreceptor activity is closely linked to changes in blood pressure. As blood pressure increases, baroreceptor activity typically increases to help stabilize the pressure by signaling the cardiovascular system to compensate.
Tips
A common mistake is to misinterpret the graph's axis labels or the inflection points indicating increases or decreases in activity.
Sources
- Oklahoma School Testing Program - sde.ok.gov
AI-generated content may contain errors. Please verify critical information