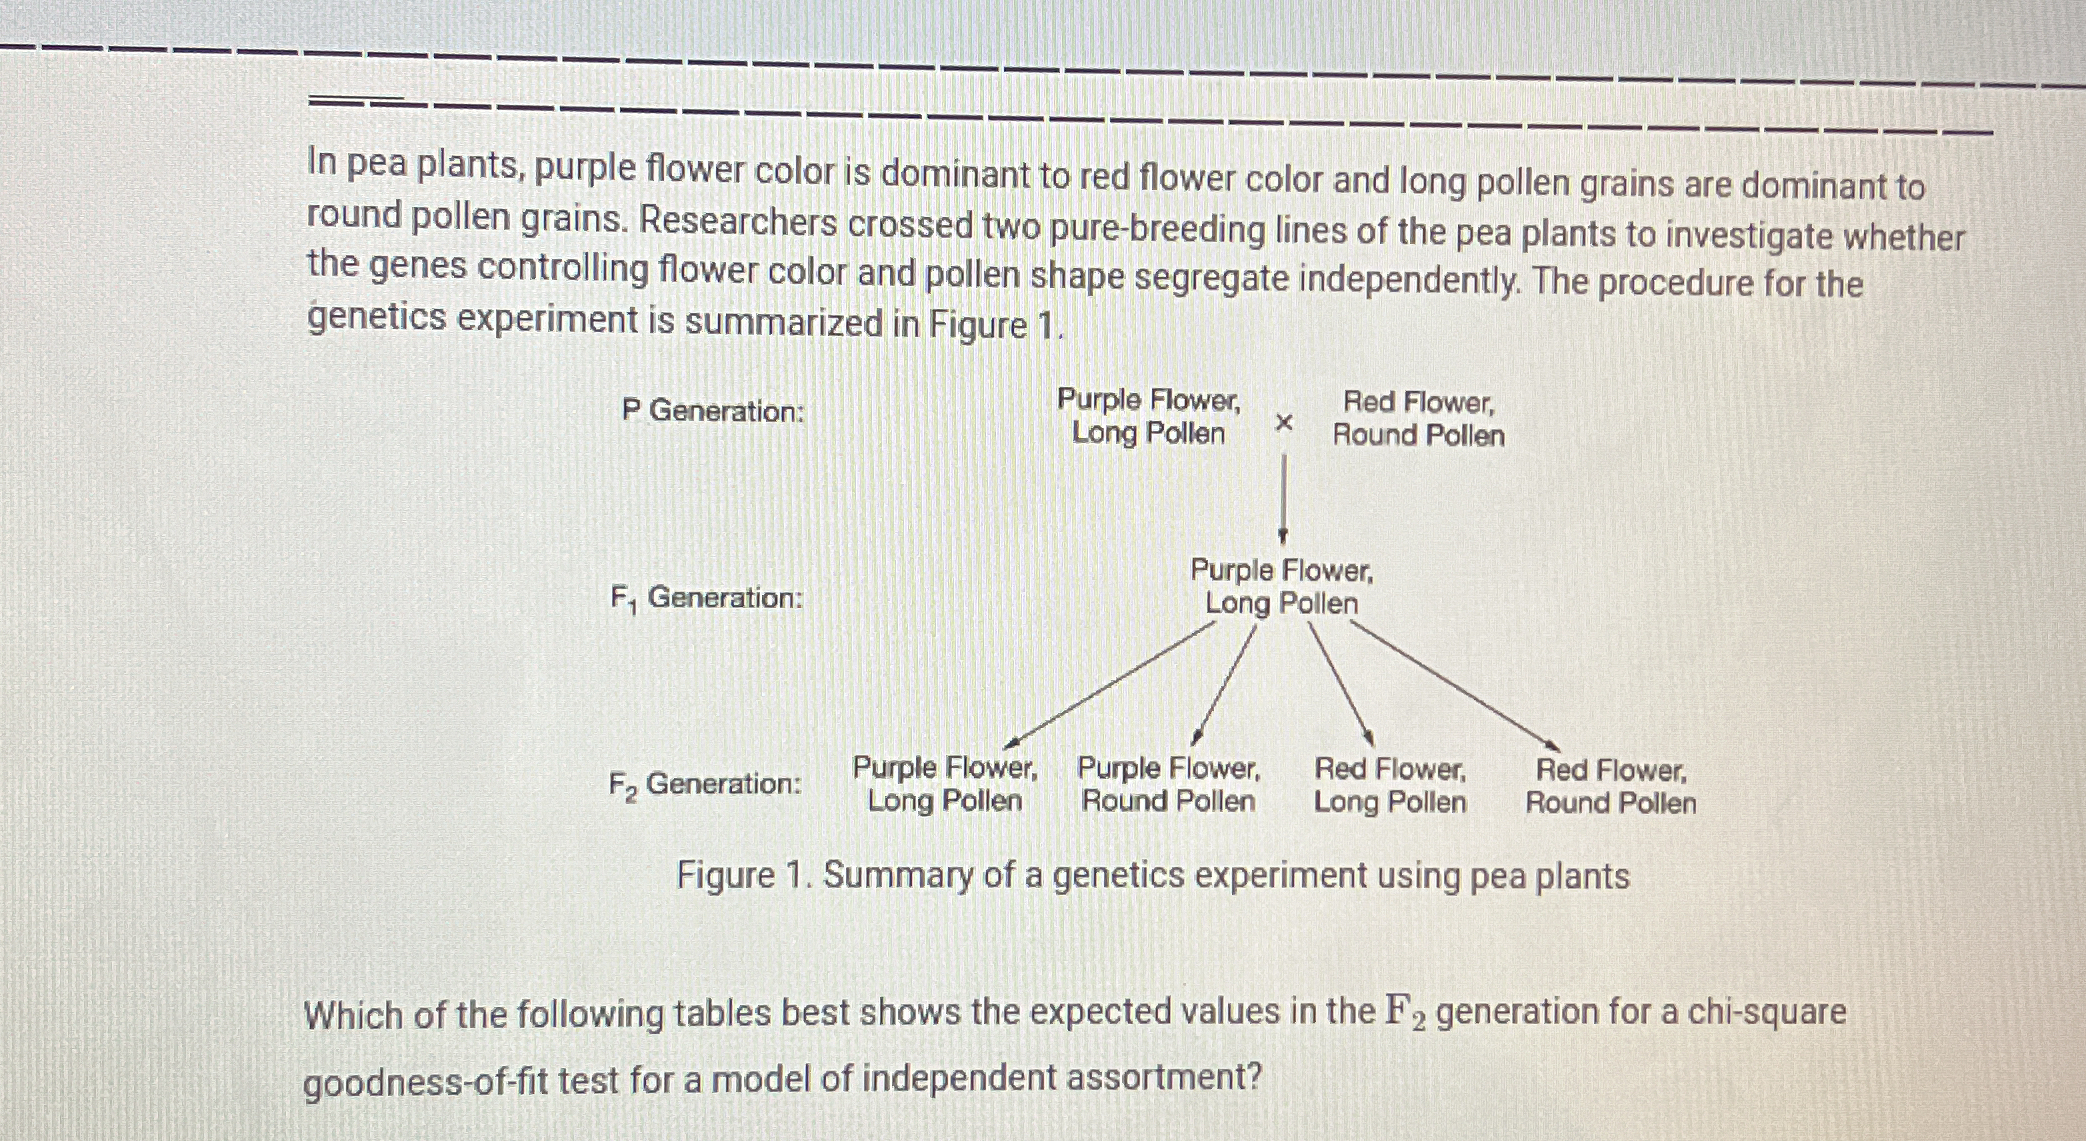
Which of the following tables best shows the expected values in the F2 generation for a chi-square goodness-of-fit test for a model of independent assortment?

Understand the Problem
The question is asking which table represents the expected values for the F2 generation in a genetics experiment concerning pea plants, specifically in relation to independent assortment and a chi-square goodness-of-fit test.
Answer
Use the 9:3:3:1 ratio for expected values.
For independent assortment, use the 9:3:3:1 ratio to determine expected values: 9/16, 3/16, 3/16, and 1/16 of the total number of F2 plants.
Answer for screen readers
For independent assortment, use the 9:3:3:1 ratio to determine expected values: 9/16, 3/16, 3/16, and 1/16 of the total number of F2 plants.
More Information
The 9:3:3:1 ratio is used in a dihybrid cross when genes assort independently, predicting the distribution of different phenotypic combinations.
Tips
A common mistake is not dividing total individuals by 16 to apply the 9:3:3:1 ratio.
Sources
- Mendelian Genetics - Chi-Square Test - ndsu.edu
AI-generated content may contain errors. Please verify critical information