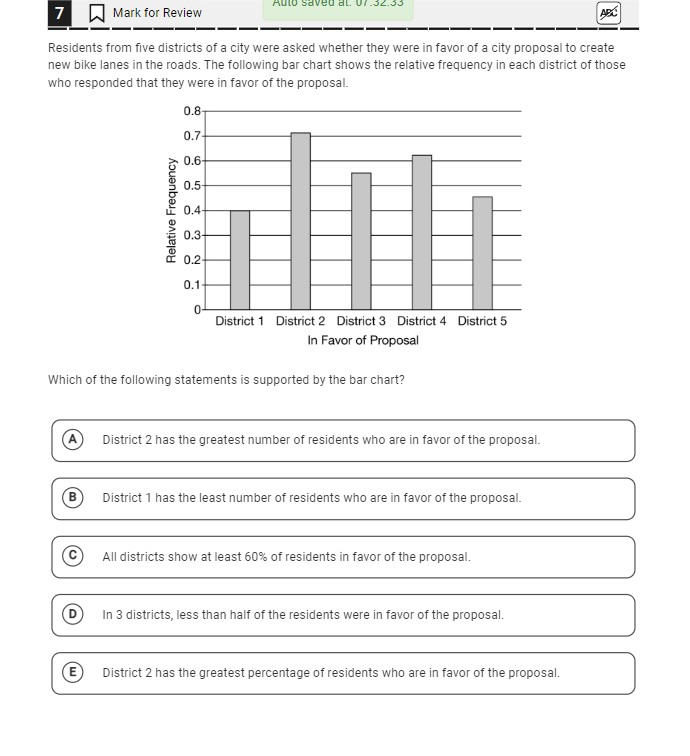
Which of the following statements is supported by the bar chart?

Understand the Problem
The question is asking which statement accurately reflects the information presented in the bar chart related to residents' support for a bike lane proposal across different districts. To solve this, we will need to analyze the bar chart data and compare it against each provided statement.
Answer
District 2 has the greatest percentage of residents who are in favor of the proposal.
The final answer is E. District 2 has the greatest percentage of residents who are in favor of the proposal.
Answer for screen readers
The final answer is E. District 2 has the greatest percentage of residents who are in favor of the proposal.
More Information
In the bar chart, District 2 has the highest relative frequency, indicating the largest proportion of residents in favor of the bike lanes proposal.
Tips
Ensure to differentiate between number and percentage when interpreting data in bar charts.
AI-generated content may contain errors. Please verify critical information