Which is the most liked genre? Which genre was chosen by 22 students? How many students picked comedy as their favorite genre? How many more students chose romance over drama? What... Which is the most liked genre? Which genre was chosen by 22 students? How many students picked comedy as their favorite genre? How many more students chose romance over drama? What is the least liked genre?

Understand the Problem
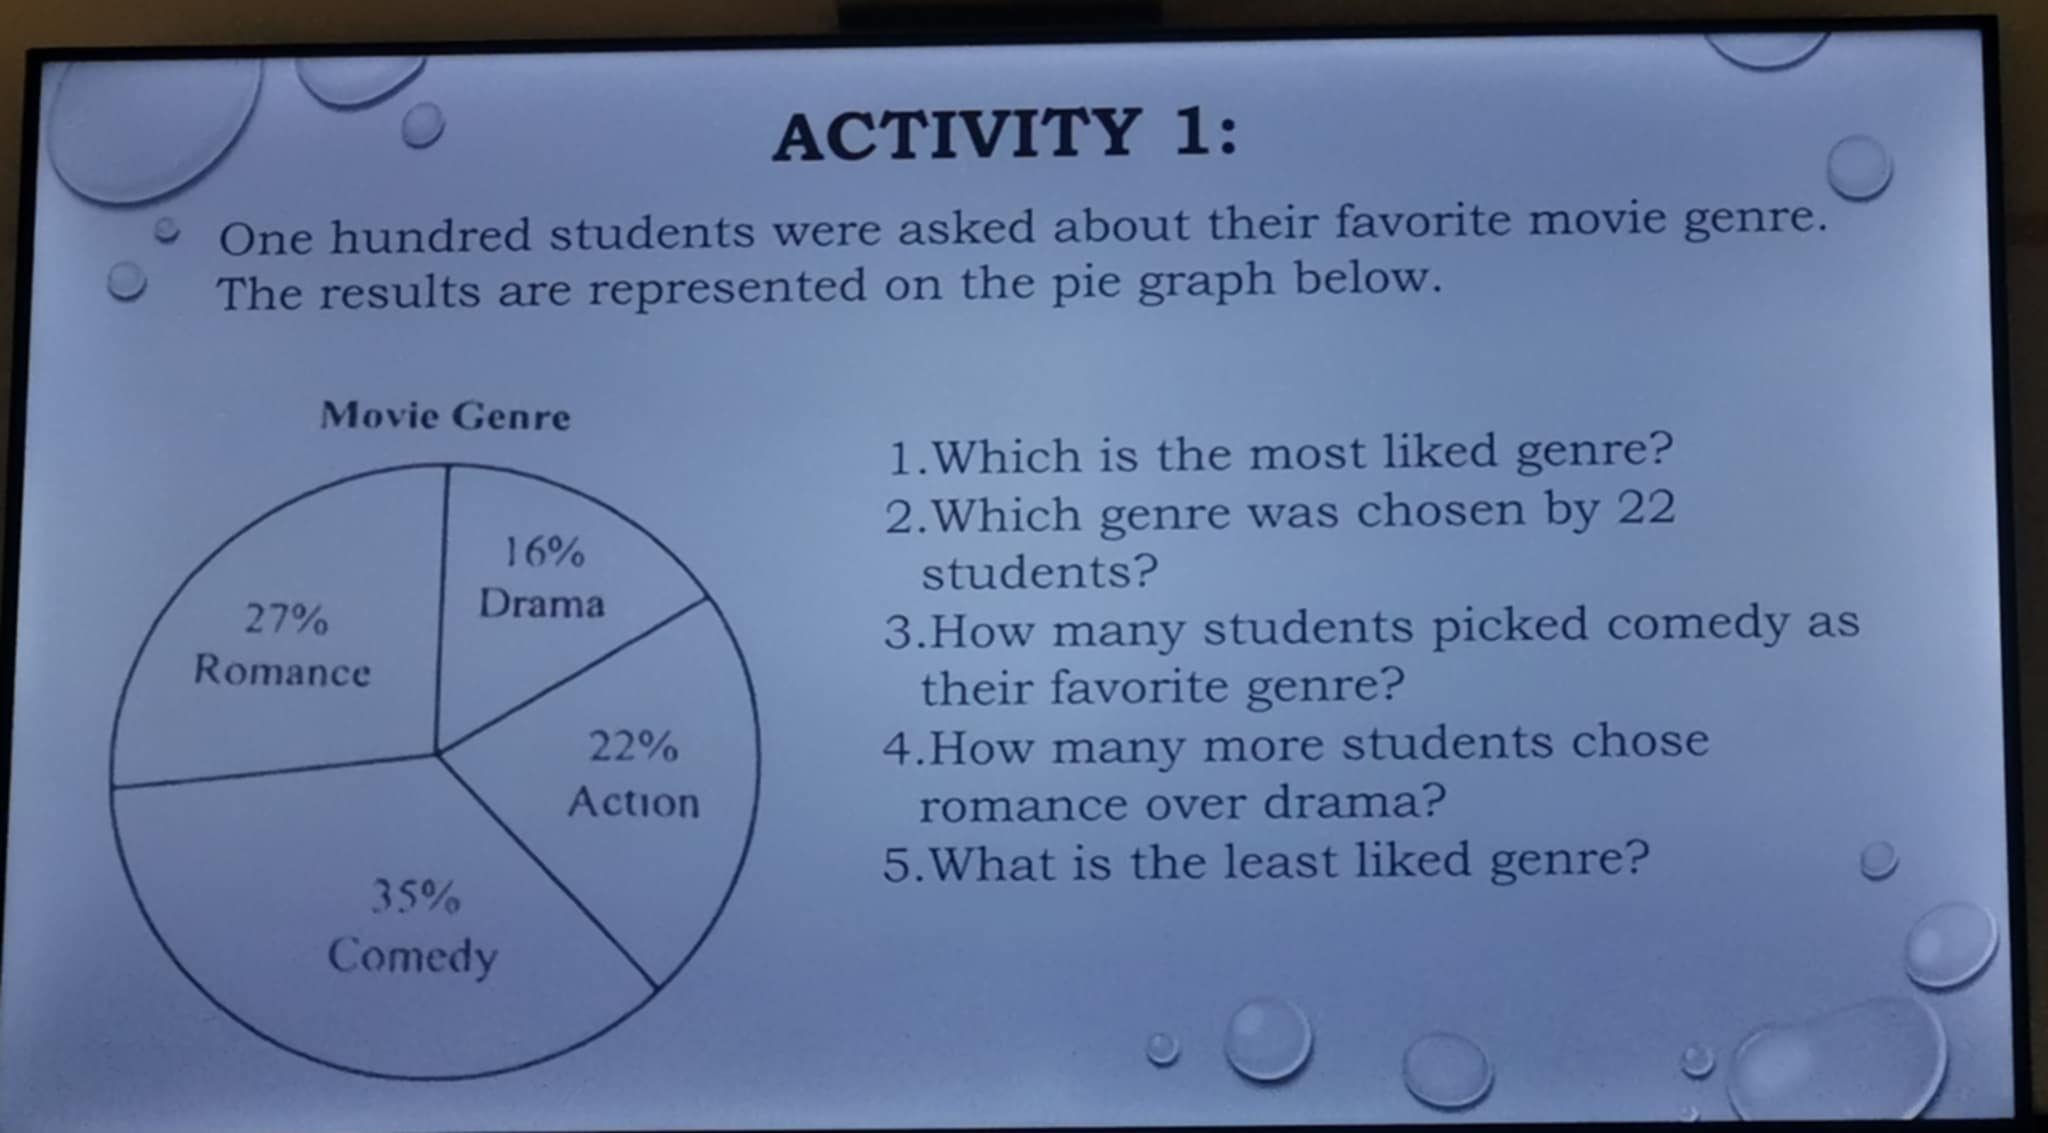
The question presents a scenario where 100 students were surveyed about their favorite movie genre, with the results in a pie chart. The questions aim to analyze the data represented in the pie chart to extract specific information.
Answer
1. Comedy 2. Action 3. 35 4. 11 5. Drama
Answer for screen readers
- The most liked genre is Comedy.
- The genre chosen by 22 students is Action.
- The number of students who picked Comedy is 35.
- 11 more students chose Romance over Drama.
- The least liked genre is Drama.
Steps to Solve
- Identify the most liked genre
From the pie chart, the genre with the highest percentage is Comedy at 35%.
- Determine the genre chosen by 22 students
To find which genre corresponds to 22 students, calculate the percentages:
-
Each percentage represents a number of students; since there are 100 students, $22 \text{ students} = 22%$.
The genre that matches this percentage is Action at 22%.
- Calculate how many students picked Comedy
From the pie chart, Comedy is 35% of the students. The total number of students is 100: $$ \text{Number of students who picked Comedy} = 35% \times 100 = 35 \text{ students} $$
- Find the difference between students who chose Romance and Drama
From the pie chart:
- Romance: 27% of 100 students
- Drama: 16% of 100 students
Calculate the number of students for each: $$ \text{Students who chose Romance} = 27% \times 100 = 27 \text{ students} $$ $$ \text{Students who chose Drama} = 16% \times 100 = 16 \text{ students} $$
Now, find how many more chose Romance over Drama: $$ \text{Difference} = 27 - 16 = 11 \text{ students} $$
- Identify the least liked genre
By inspecting the pie chart, the least liked genre is Drama at 16%.
- The most liked genre is Comedy.
- The genre chosen by 22 students is Action.
- The number of students who picked Comedy is 35.
- 11 more students chose Romance over Drama.
- The least liked genre is Drama.
More Information
The pie chart reflects the preferences of students in a clear visual format, making it easy to see which genres are favored. The percentages clearly show the popularity of each genre.
Tips
- Failing to translate percentages into actual student counts. It's essential to remember that percentages must be multiplied by the total number to find the corresponding numbers.
- Not double-checking which percentage represents the specific number of students asked in the question.
AI-generated content may contain errors. Please verify critical information