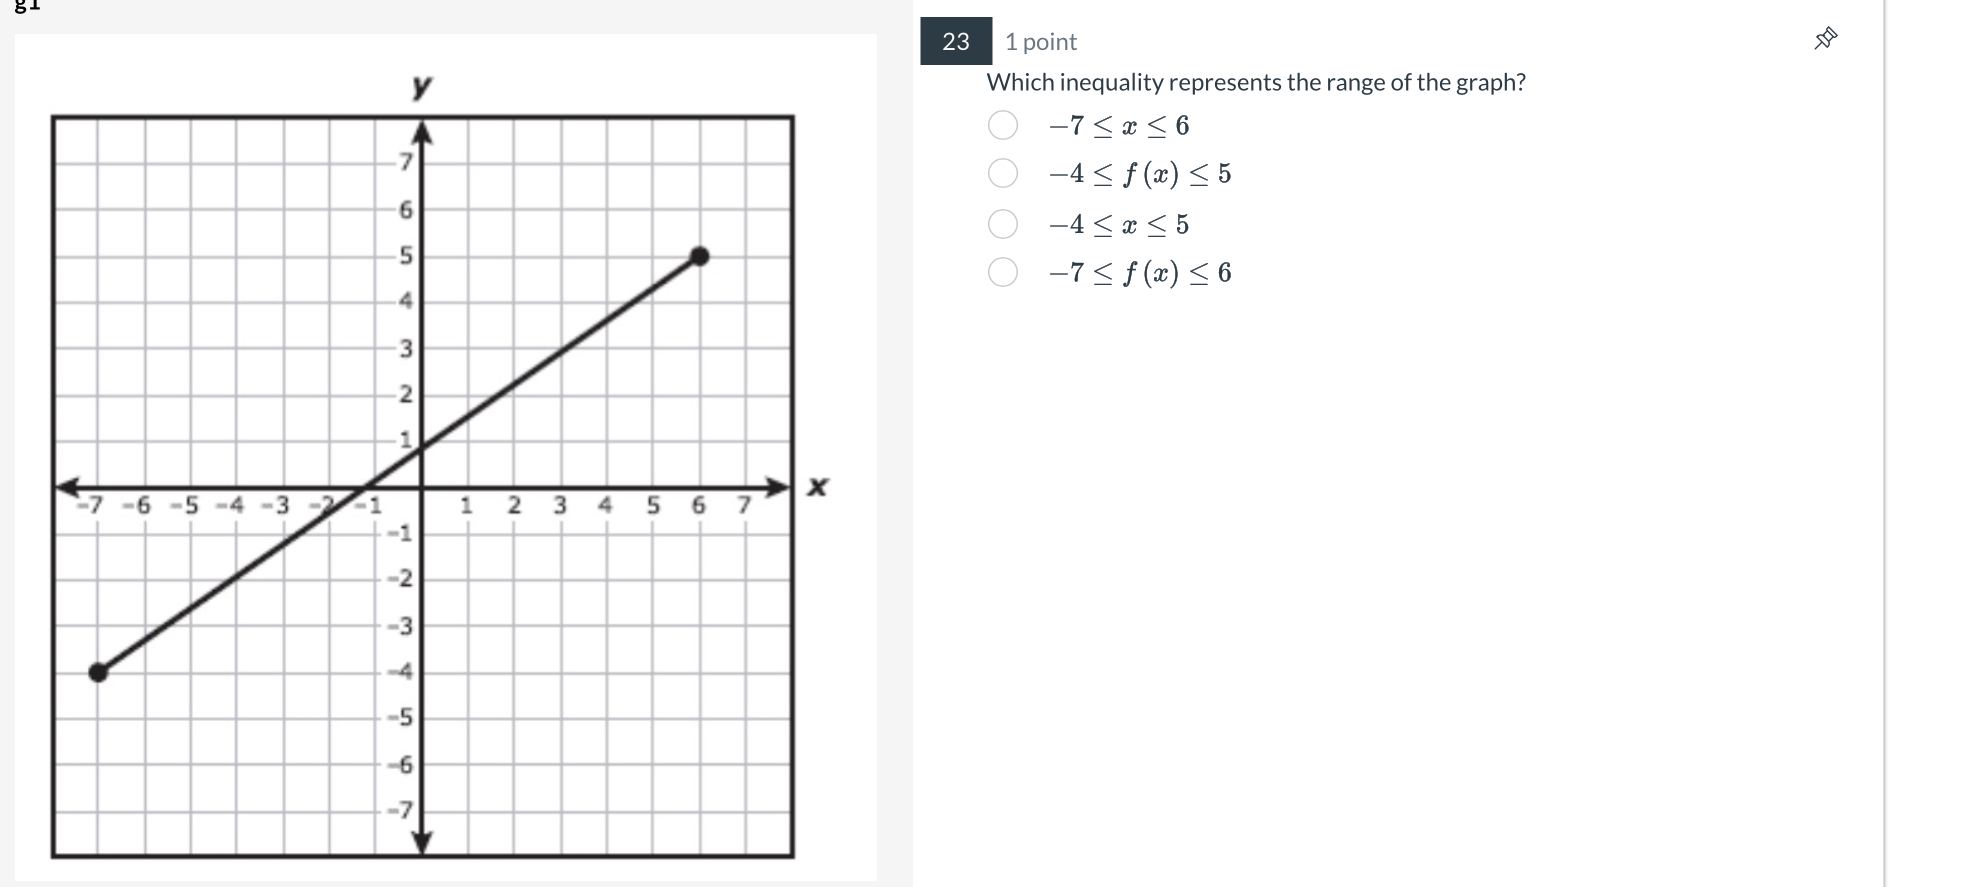
Which inequality represents the range of the graph?

Understand the Problem
The question is asking which inequality represents the range of values for the graph displayed. It requires identifying the limits of the range based on the graphed function.
Answer
The inequality representing the range is $$-4 \leq f(x) \leq 6$$.
Answer for screen readers
The inequality representing the range is $$-4 \leq f(x) \leq 6$$.
Steps to Solve
-
Identify the endpoints of the graph
From the graph, observe the points where the line starts and ends. The graph begins at the point $(-7, -4)$ and ends at the point $(6, 6)$.
-
Determine the range of $f(x)$ values
The $y$-values at the endpoints represent the lowest and highest values that $f(x)$ reaches.
- The lowest value is $f(-7) = -4$ and the highest value is $f(6) = 6$.
-
Formulate the inequality
The range of values for $f(x)$ can be represented by the inequality considering the endpoints identified previously:
- This results in the inequality: $$-4 \leq f(x) \leq 6$$
The inequality representing the range is $$-4 \leq f(x) \leq 6$$.
More Information
The function graphed shows a linear relationship and the endpoints indicate the limits of the function. Thus, the inequality helps to express this relationship clearly in mathematical terms.
Tips
- Confusing domain and range: Sometimes, students might confuse $x$ (the domain) with $f(x)$ (the range). Ensure to focus on the outputs ($f(x)$ values) rather than inputs ($x$ values) when determining the range.
AI-generated content may contain errors. Please verify critical information