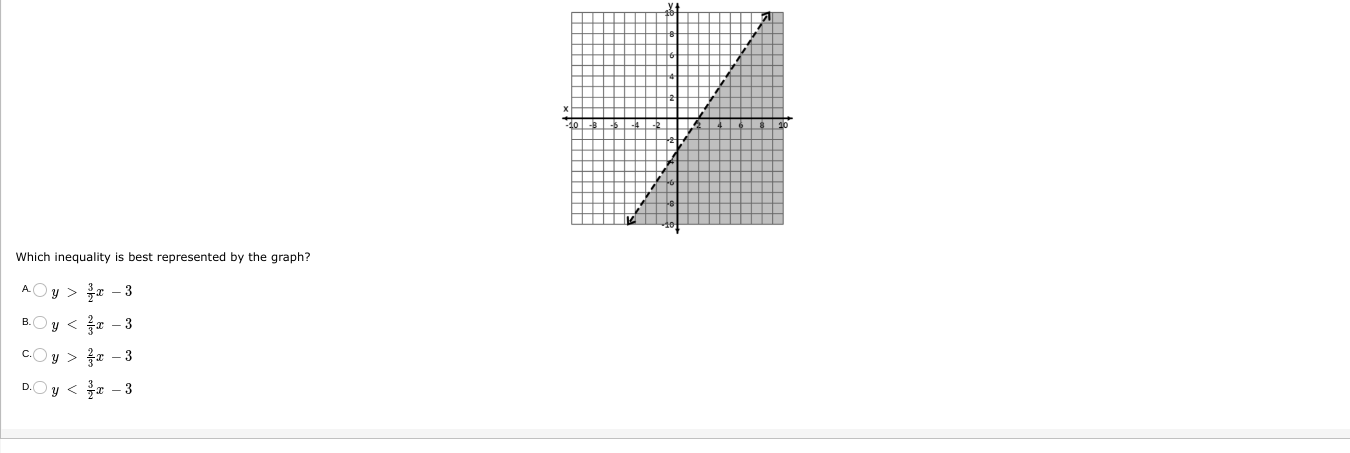
Which inequality is best represented by the graph?

Understand the Problem
The question is asking which inequality is represented by the given graph. The graph shows a line and a shaded area, suggesting a specific relationship between x and y. We need to determine the correct inequality from the given options based on the graph.
Answer
$y > \frac{1}{2}x - 3$
Answer for screen readers
The correct inequality represented by the graph is: $y > \frac{1}{2}x - 3$.
Steps to Solve
- Identify the line equation Examine the graph to determine the equation of the line. The line appears to be in the form of $y = mx + b$, where $m$ is the slope and $b$ is the y-intercept. The slope ($m$) can be observed from the rise over run. The line crosses the y-axis at $-3$, and through points $(0, -3)$ and $(6, 0)$, which gives us a slope of:
$$ m = \frac{0 - (-3)}{6 - 0} = \frac{3}{6} = \frac{1}{2} $$
Thus, the equation is:
$$ y = \frac{1}{2}x - 3 $$
-
Determine the shading direction Next, observe the shading direction. The area above the line indicates that the inequality will be either greater than or less than. In this case, the shaded area is above the line, which corresponds to the inequality $y > \frac{1}{2}x - 3$.
-
Match with given options Now compare this inequality with the provided options. The inequality represented by the line is:
- A: $y > \frac{3}{2}x - 3$
- B: $y \leq \frac{2}{3}x - 3$
- C: $y > \frac{3}{2}x - 3$
- D: $y < \frac{3}{2}x - 3$
Notice that the correct formulation aligns with $y > \frac{1}{2}x - 3$. However, since none of the options match directly, review the slope related equations again to confirm whether $y > \frac{3}{2}x -3$ is the relevant choice if existing in the context. However, looking closely the correct slope is indeed the $1/2$ version.
The correct inequality represented by the graph is: $y > \frac{1}{2}x - 3$.
More Information
This inequality shows that for each value of $x$, $y$ has to be greater than the linear expression $\frac{1}{2}x - 3$. In graphing terms, this creates a region above the line described by this equation.
Tips
- Confusing the slope of the line; it could have been misread leading to choosing an inappropriate inequality.
- Not carefully observing the direction of shading could prompt a conclusion of $\leq$ or $\geq$ instead of just $>$.
AI-generated content may contain errors. Please verify critical information