Which inequality best describes the range of this function?

Understand the Problem
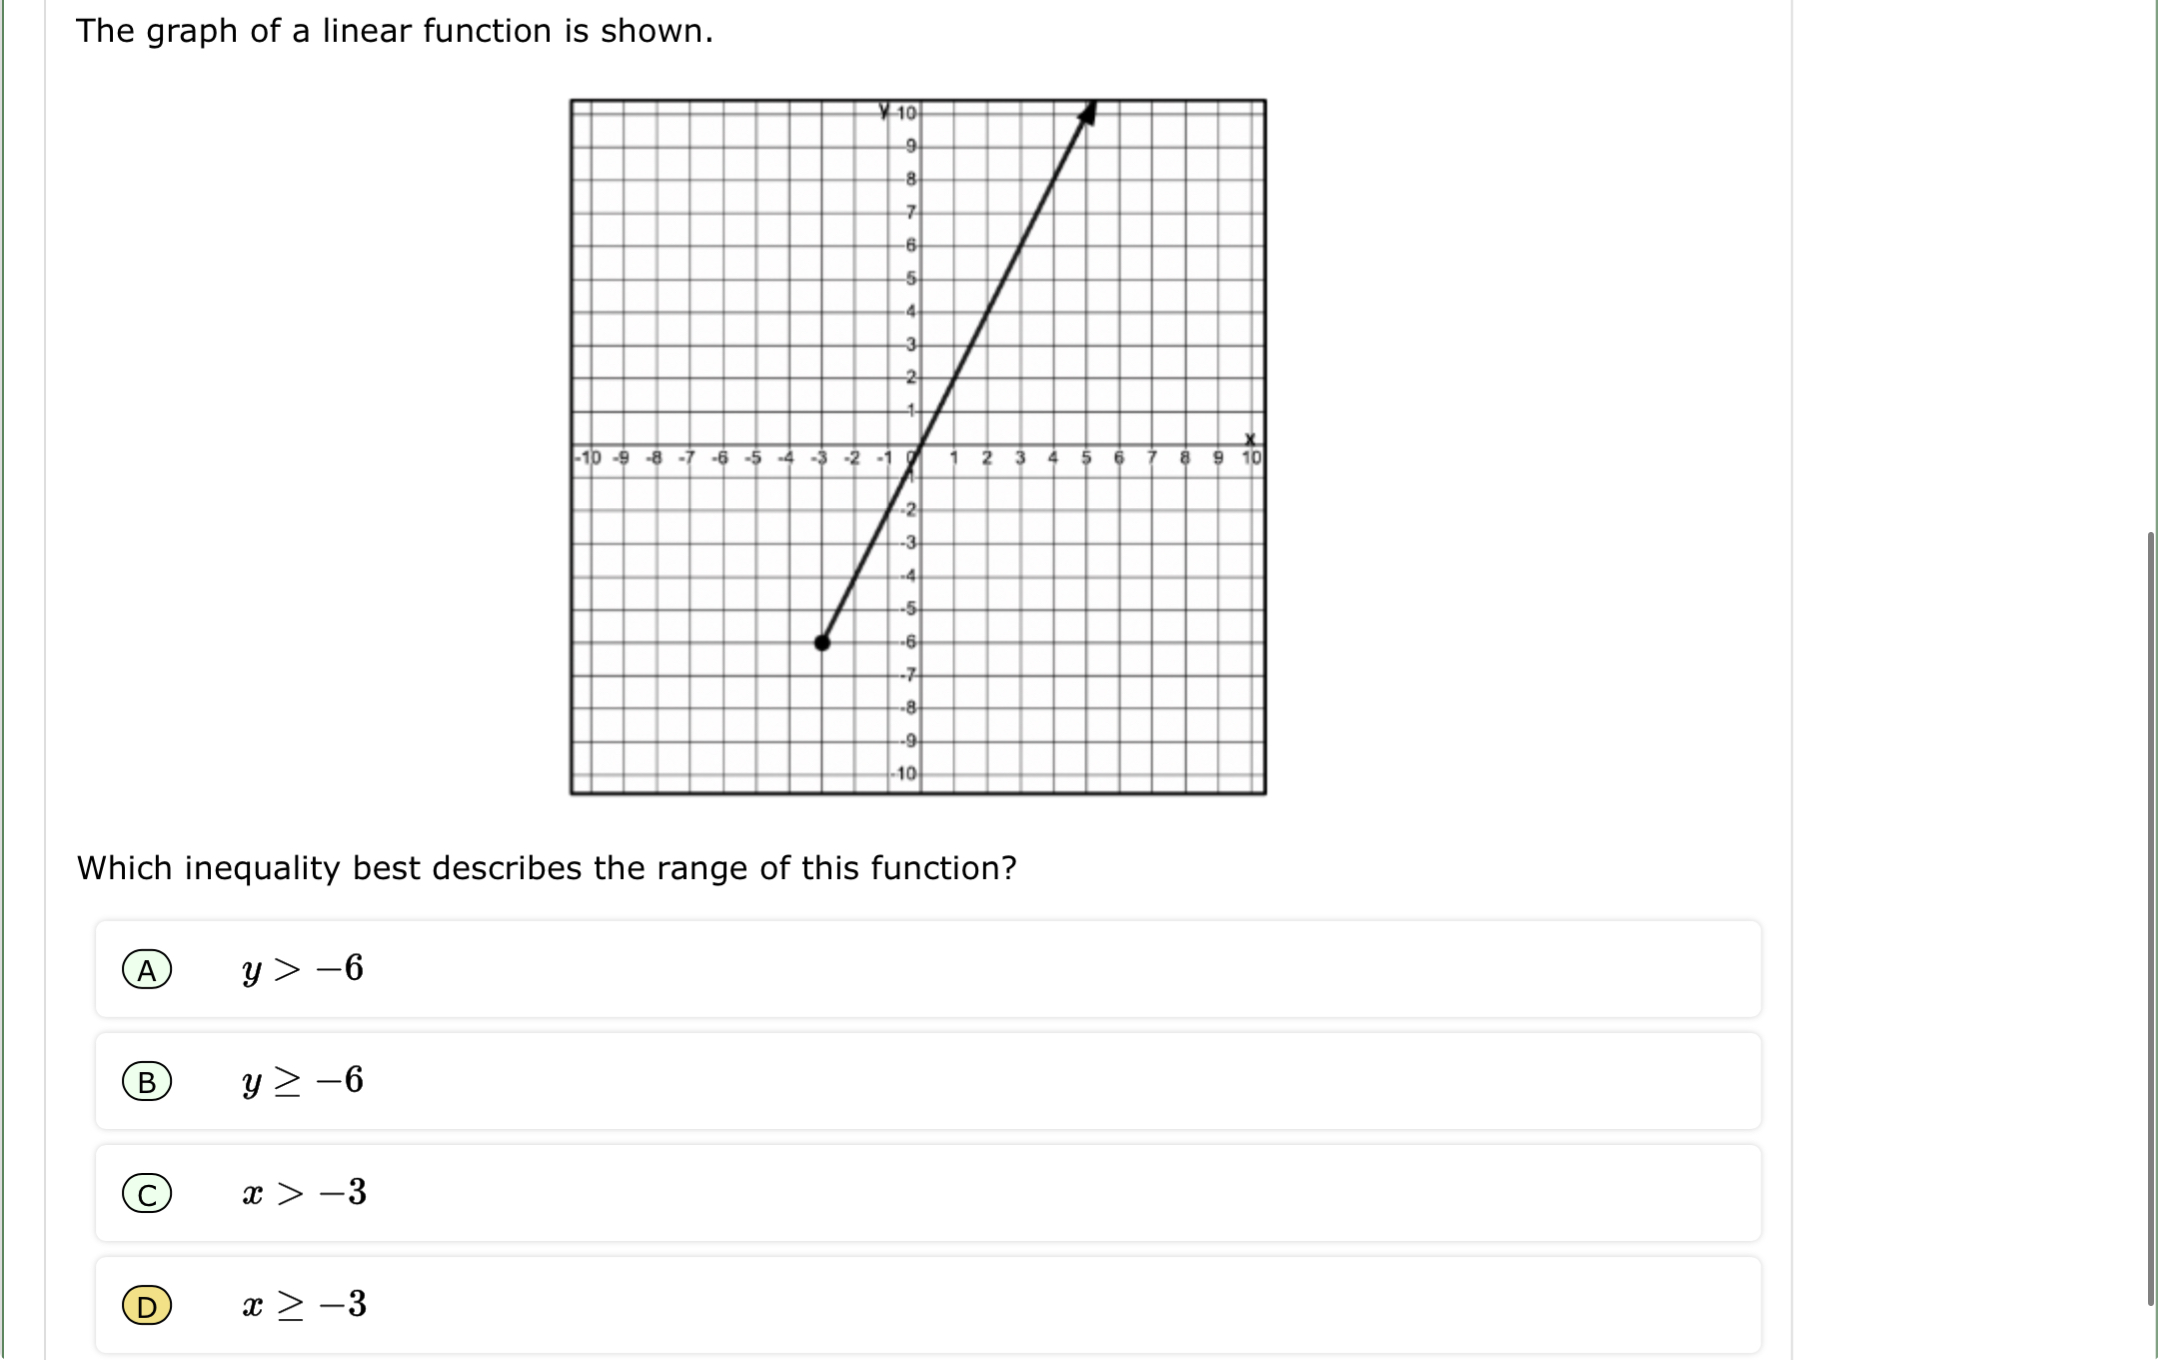
The question asks which inequality appropriately describes the range of a given linear function based on its graph. To solve it, we need to analyze the graph and determine the lowest value of y present on the plotted function's line.
Answer
The range of the function is \( y \geq -6 \).
Answer for screen readers
The inequality that describes the range of the function is ( y \geq -6 ).
Steps to Solve
- Identify the lowest point on the graph
Look at the graph to find the lowest value on the function's line. It appears that the lowest point on the graph corresponds to the y-value of $-6$, which is included in the graph.
- Determine the type of inequality
Since the line includes the point where $y = -6$, this suggests that the inequality should be inclusive. Therefore, we will use the $\geq$ symbol to properly represent the range of y-values.
- Write the appropriate inequality
Based on the analysis, we can express the range of the function with the inequality:
$$ y \geq -6 $$
The inequality that describes the range of the function is ( y \geq -6 ).
More Information
This range indicates that the function includes all y-values greater than or equal to $-6$, reflecting that the line starts at $-6$ and rises indefinitely. This is a common characteristic of linear functions.
Tips
- Confusing the type of inequality: Remember that if the line includes a specific point, use $\geq$ or $\leq$ instead of $>$ or $<$.
- Incorrectly identifying the lowest point: Always double-check the plotted points on the graph to ensure accuracy.
AI-generated content may contain errors. Please verify critical information