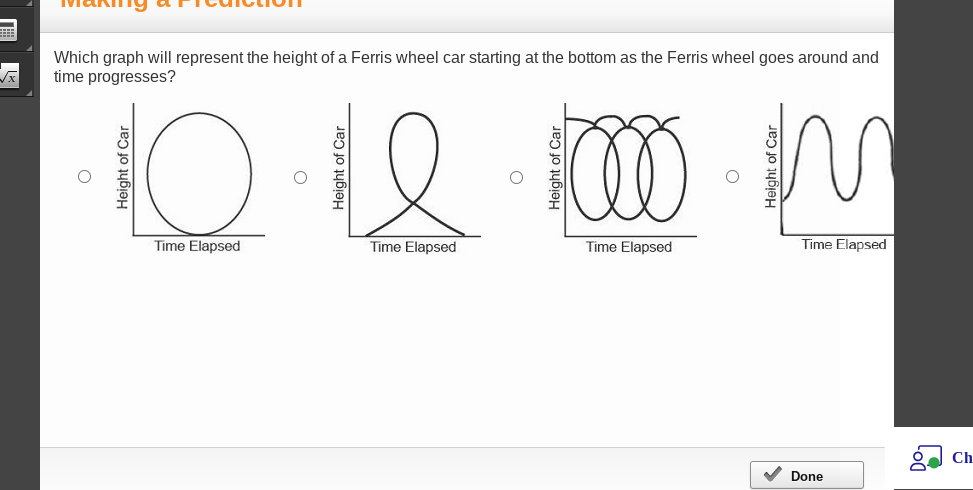
Which graph will represent the height of a Ferris wheel car starting at the bottom as the Ferris wheel goes around and time progresses?

Understand the Problem
The question is asking to identify which graph accurately represents the height of a Ferris wheel car over time, beginning from the lowest point. It requires understanding the cyclical nature of a Ferris wheel's motion.
Answer
Far right graph represents a sinusoidal pattern.
The final answer is the graph on the far right, which shows a sinusoidal pattern.
Answer for screen readers
The final answer is the graph on the far right, which shows a sinusoidal pattern.
More Information
The graph showing a sinusoidal pattern matches the periodic nature of a Ferris wheel's rotational movement.
Tips
Common mistakes include misinterpreting the start point or not recognizing the periodic nature of the movement.