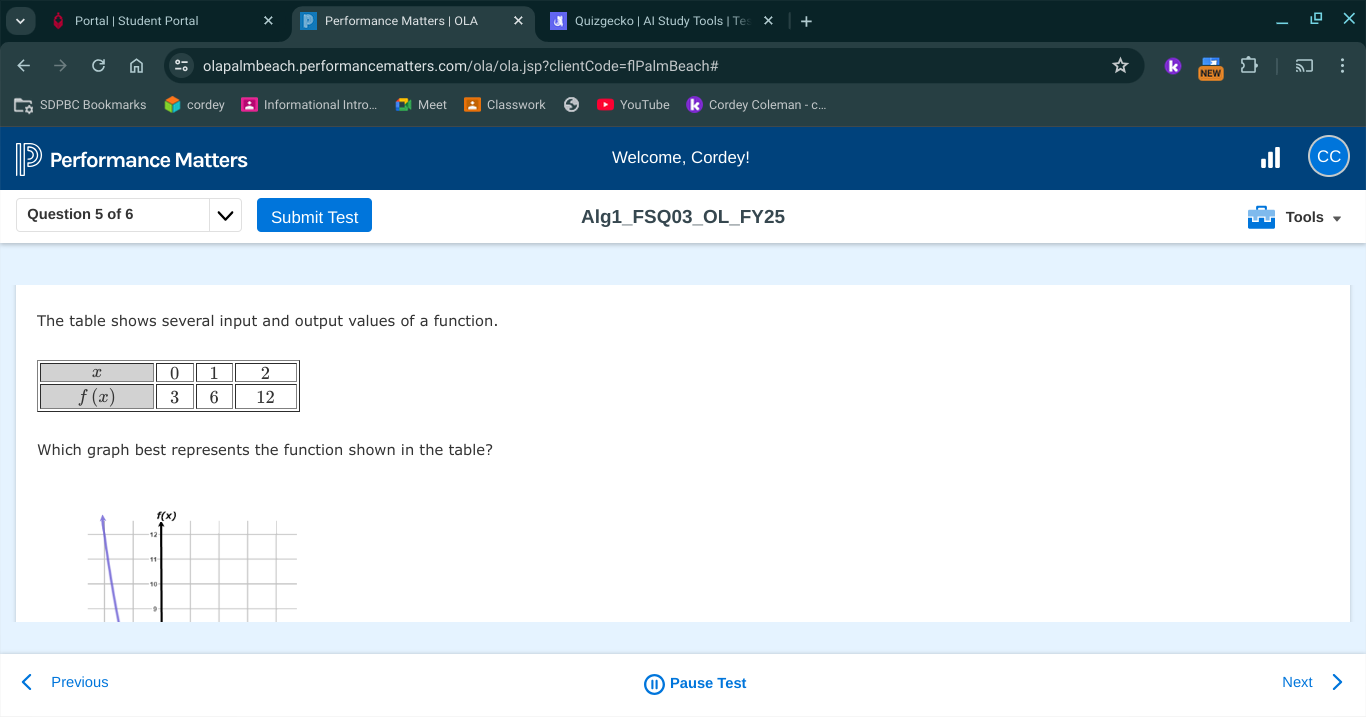
Which graph best represents the function shown in the table?

Understand the Problem
The question is asking which graph best represents the function based on the input-output values provided in the table. The task involves analyzing the function values for different x inputs (0, 1, 2) and their corresponding f(x) values (3, 6, 12) to determine the correct graphical representation.
Answer
The graph shows points (0, 3), (1, 6), (2, 12) with an increasing rate of change, likely resembling exponential growth.
Answer for screen readers
The graph representing the function is one that shows the points (0, 3), (1, 6), and (2, 12) with a suitable increasing rate. The correct graph could resemble an exponential growth pattern.
Steps to Solve
-
Identify the Input-Output Pairs
From the table, we have the following points:
- When $x = 0$, $f(x) = 3$
- When $x = 1$, $f(x) = 6$
- When $x = 2$, $f(x) = 12$
-
Calculate the Rate of Change
To understand how the function behaves, calculate the changes in $f(x)$ per unit change in $x$:
- From $x=0$ to $x=1$:
$$ \text{Change} = f(1) - f(0) = 6 - 3 = 3 $$ - From $x=1$ to $x=2$:
$$ \text{Change} = f(2) - f(1) = 12 - 6 = 6 $$
-
Identify the Pattern
The function changes by 3 from $f(0)$ to $f(1)$ and by 6 from $f(1)$ to $f(2)$. This indicates that the function is not linear, as the rate of change is increasing. -
Assess the Graphs
Look for a graph that shows an increasing rate of change, possibly exponential or quadratic in nature. The graph should increase gently at first and then rise more steeply. -
Select the Correct Graph
Choose the graph that aligns with the input-output pairs showing the increasing nature of the function.
The graph representing the function is one that shows the points (0, 3), (1, 6), and (2, 12) with a suitable increasing rate. The correct graph could resemble an exponential growth pattern.
More Information
The output values indicate that as $x$ increases, $f(x)$ grows at an increasing rate. This is suggestive of an exponential function where growth accelerates as the input increases.
Tips
- Assuming the function is linear. It's crucial to verify the rate of change between points to determine the nature of the function.
- Misinterpreting the graph by not paying attention to the accelerating growth characteristic.
AI-generated content may contain errors. Please verify critical information