Understand the Problem
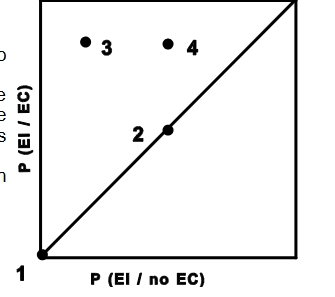
The question is asking us to interpret a graph that displays probabilities related to different scenarios (EI/EC and EI/no EC). Each point may represent specific probabilities, but no explicit question is presented.
Answer
Points above the line suggest a higher probability of EI with EC than without.
This graph seems to represent a comparison of probabilities: P(EI / EC) vs. P(EI / no EC). Points above the diagonal line indicate situations where the probability of EI given EC is higher than without EC. This suggests a positive association between EC and EI.
Answer for screen readers
This graph seems to represent a comparison of probabilities: P(EI / EC) vs. P(EI / no EC). Points above the diagonal line indicate situations where the probability of EI given EC is higher than without EC. This suggests a positive association between EC and EI.
More Information
This type of graph is often used to show effectiveness or impact of a condition or treatment. Points above the line indicate increased effectiveness, while points below indicate decreased effectiveness.
Tips
Omitting interpretation of points on the line.
AI-generated content may contain errors. Please verify critical information