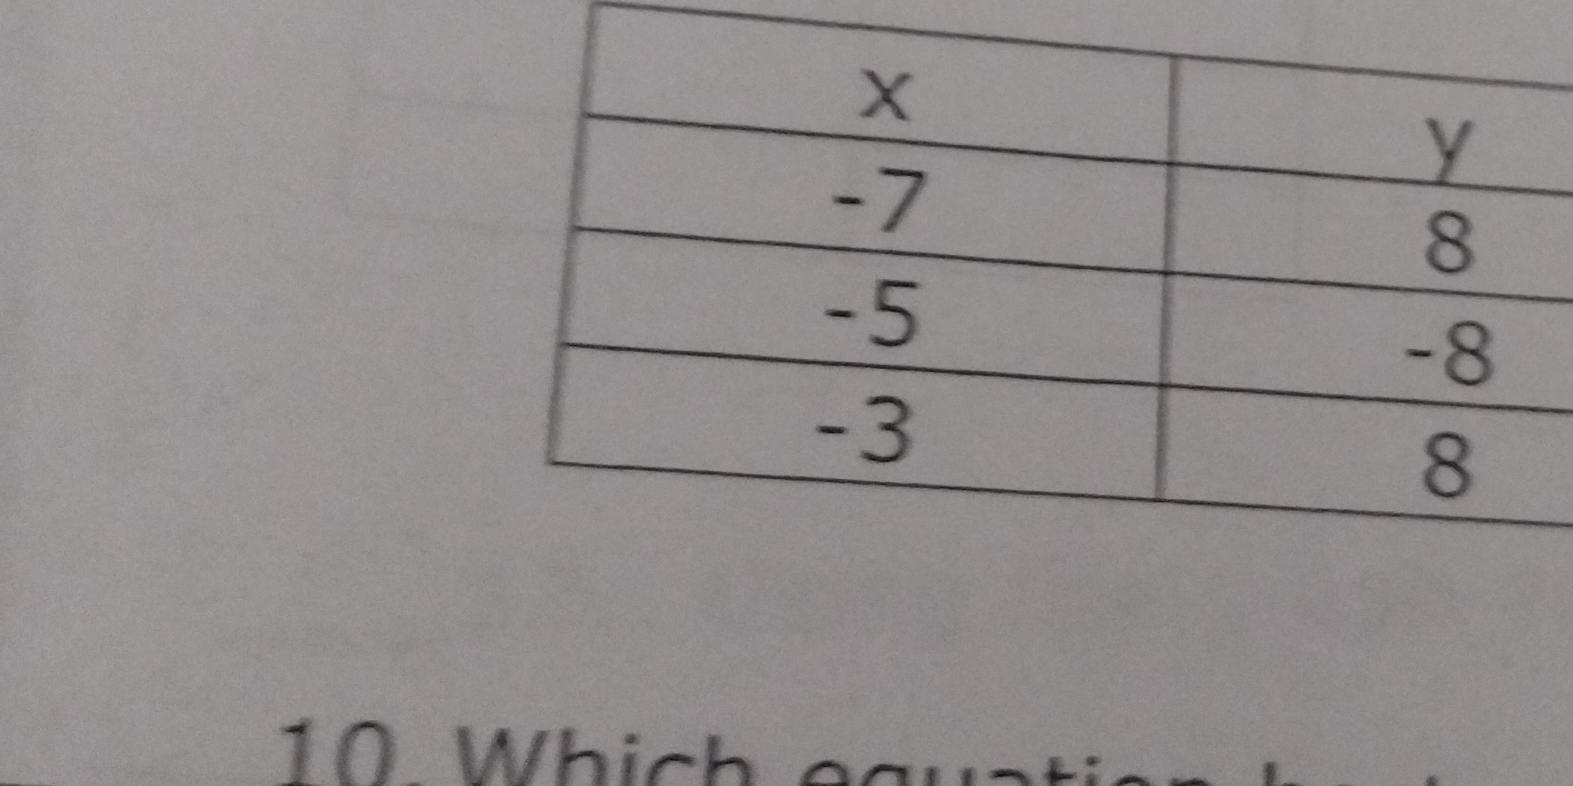
Which equation has the following pairs: (-7, 8), (-5, -8), (-3, 8)?

Understand the Problem
The question is asking which equation fits the given pairs of x and y values displayed in the table. We need to identify a mathematical relationship based on these corresponding values.
Answer
$$y = -8(x + 5) + 8$$
Answer for screen readers
A potential function fitting the points is:
$$y = -8(x + 5) + 8$$ for the range of values based on piecewise behavior.
Steps to Solve
-
List Given Points The points from the table are:
$(-7, 8)$, $(-5, -8)$, and $(-3, 8)$. -
Determine the Relationship To find a possible equation, let's look for patterns in the $y$ values relative to the $x$ values. We can start by comparing the pairs:
- For $x = -7$, $y = 8$
- For $x = -5$, $y = -8$
- For $x = -3$, $y = 8$
-
Examine Changes in $y$ Identify how $y$ changes with $x$:
- From $-7$ to $-5$, $y$ changes from $8$ to $-8$, a decrease of $16$.
- From $-5$ to $-3$, $y$ changes from $-8$ to $8$, an increase of $16$.
-
Analyze Possible Equation Types Since there is significant fluctuation, consider that the relationship might be a piecewise function or an oscillating function.
-
Test Possible Functions One likely candidate could be a quadratic equation or piecewise functions since $y$ is the same again at $x = -3$.
Trying the quadratic form $y = ax^2 + bx + c$ is one way to explore this, but given the pairs, we could also try simpler linear equations with the points. -
Test Example Linear Equations
- For line segments between points, analyze them:
The slope from $(-7, 8)$ to $(-5, -8)$ is calculated as: $$ m = \frac{-8 - 8}{-5 + 7} = \frac{-16}{2} = -8.$$ - This could help define segments of a piecewise function.
- For line segments between points, analyze them:
-
Construct Final Equation Based on coordinates and changes of sign in $y$, you can hypothesize relationships that reflect these changes.
A potential function fitting the points is:
$$y = -8(x + 5) + 8$$ for the range of values based on piecewise behavior.
More Information
The relationship among the $x$ and $y$ values indicates an oscillating pattern, which could mean that as $x$ increases, $y$ fluctuates significantly in a non-linear manner.
Tips
- Assuming a linear relationship when the data suggests something more complex (like quadratic).
- Ignoring negative values which can drastically change the shape of the function.
AI-generated content may contain errors. Please verify critical information