Which choice best describes data from the table that supports the student's argument?

Understand the Problem
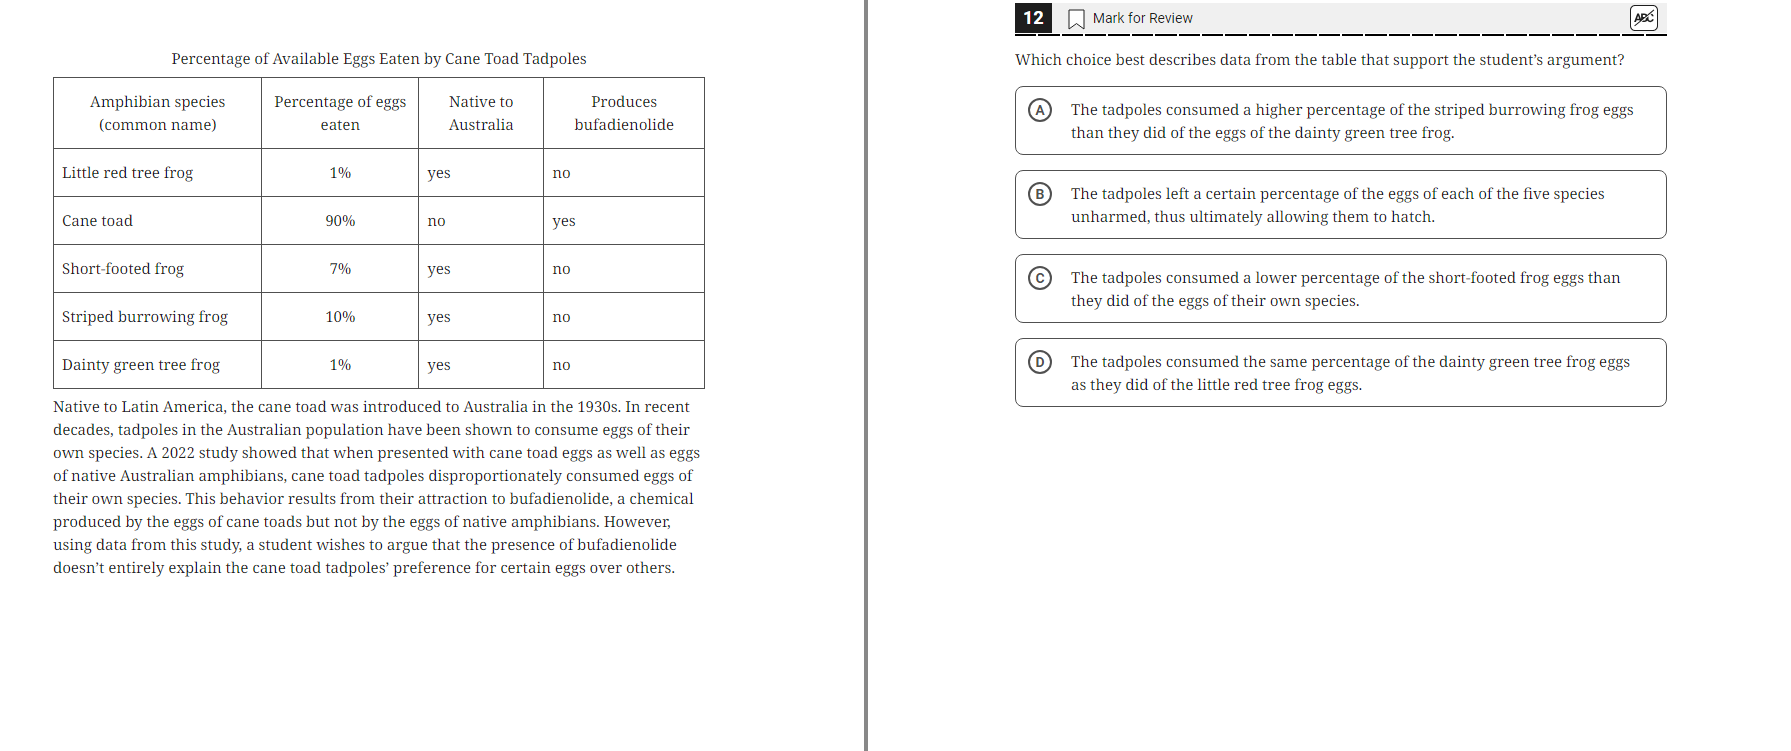
The question asks to identify which choice accurately describes the data in the table concerning the consumption percentages of different amphibian species' eggs by cane toad tadpoles. It requires interpreting the given table data to select the correct statement that supports a student's argument related to tadpole behavior.
Answer
C: The tadpoles consumed a lower percentage of the short-footed frog eggs than they did of the eggs of their own species.
The final answer is C: The tadpoles consumed a lower percentage of the short-footed frog eggs than they did of the eggs of their own species.
Answer for screen readers
The final answer is C: The tadpoles consumed a lower percentage of the short-footed frog eggs than they did of the eggs of their own species.
More Information
The percentage of cane toad eggs consumed (90%) is significantly higher than that for any other species, supporting the student's argument about cane toads' preference for their own eggs.
Tips
A common mistake is not carefully comparing the percentages from the table against each choice. Ensure to identify the key data points relevant to the argument.
AI-generated content may contain errors. Please verify critical information