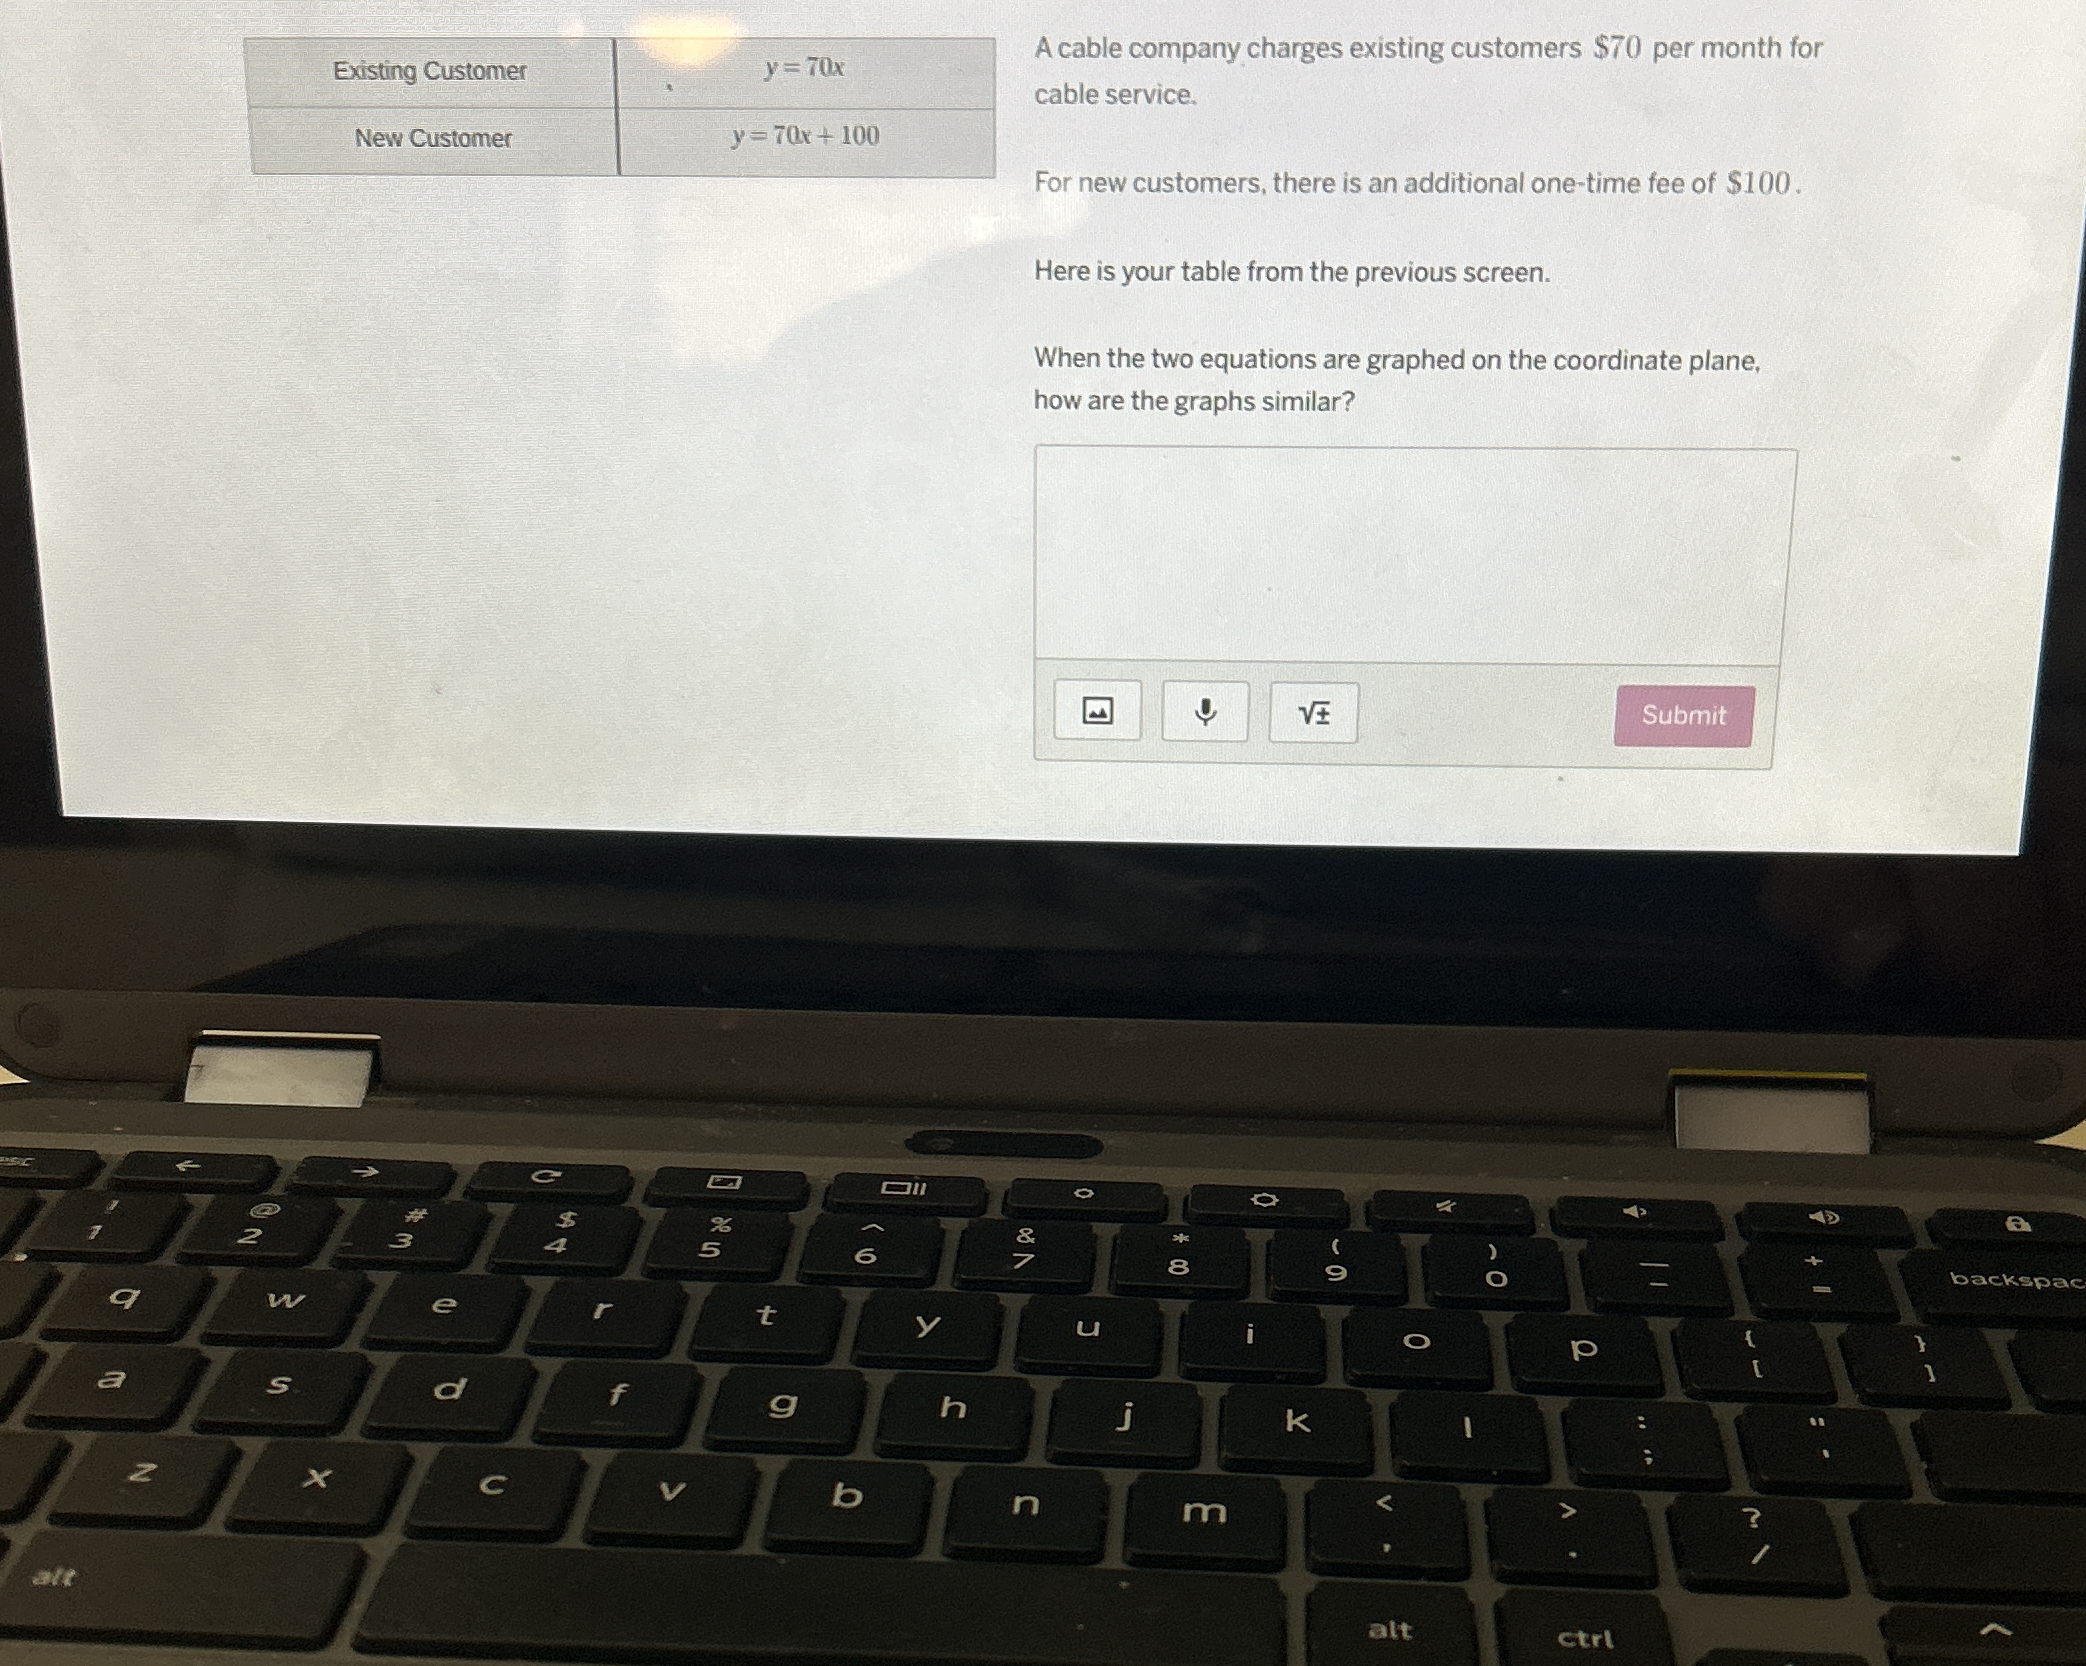
When the two equations are graphed on the coordinate plane, how are the graphs similar?

Understand the Problem
The question is asking for an analysis of how the graphs of the two equations for existing and new customers are similar when plotted on a coordinate plane. The key concepts involve understanding the equations given and how they relate to graph characteristics like slope and y-intercept.
Answer
The graphs have the same slope of 70 (same growth rate) but differ in y-intercepts (0 for existing customers, 100 for new customers).
Answer for screen readers
The graphs of the two equations are similar in that they have the same slope of 70, meaning both types of customers experience the same rate of increase in monthly charges. However, they differ in their y-intercepts; the existing customer graph starts at 0, while the new customer graph starts at 100.
Steps to Solve
-
Identify the Equations
The two equations for existing and new customers are:
- Existing Customer: $y = 70x$
- New Customer: $y = 70x + 100$
-
Understand the Slope
Both equations have the same slope of 70. This means that for every additional month (increase in $x$ by 1), both types of customers will pay an additional $70.
- Slope: $m = 70$
-
Understand the Y-Intercept
The y-intercept of the existing customer equation is 0 (when $x = 0$, $y = 0$). The y-intercept for the new customer is 100 (when $x = 0$, $y = 100$). This indicates that new customers start with an additional cost of $100 before monthly charges begin.
- Existing Customer Y-Intercept: $b = 0$
- New Customer Y-Intercept: $b = 100$
-
Graph Characteristics
When graphed, both lines will be parallel because they have the same slope. The line for new customers will be shifted upward by 100 units compared to the existing customer's line. -
Conclusion About Similarity
Although the two graphs rise at the same rate (due to the same slope), they differ in their starting points (y-intercepts). This means that while their growth patterns are similar, their initial costs are different.
The graphs of the two equations are similar in that they have the same slope of 70, meaning both types of customers experience the same rate of increase in monthly charges. However, they differ in their y-intercepts; the existing customer graph starts at 0, while the new customer graph starts at 100.
More Information
The similarity in slopes indicates that both customer groups will have the same growth rate in their monthly expenses over time. The additional $100 fee for new customers reflects a different initial payment but does not change how monthly costs increase.
Tips
- Confusing Slope with Y-Intercept: Ensure to differentiate between how steep the lines are (slope) and where they start (y-intercept).
- Forgetting the Impact of the Y-Intercept: Realize that the $100 additional fee does not affect the rate of increase but does shift the initial cost upwards.
AI-generated content may contain errors. Please verify critical information