What is the law of demand and how is it represented in the demand function?

Understand the Problem
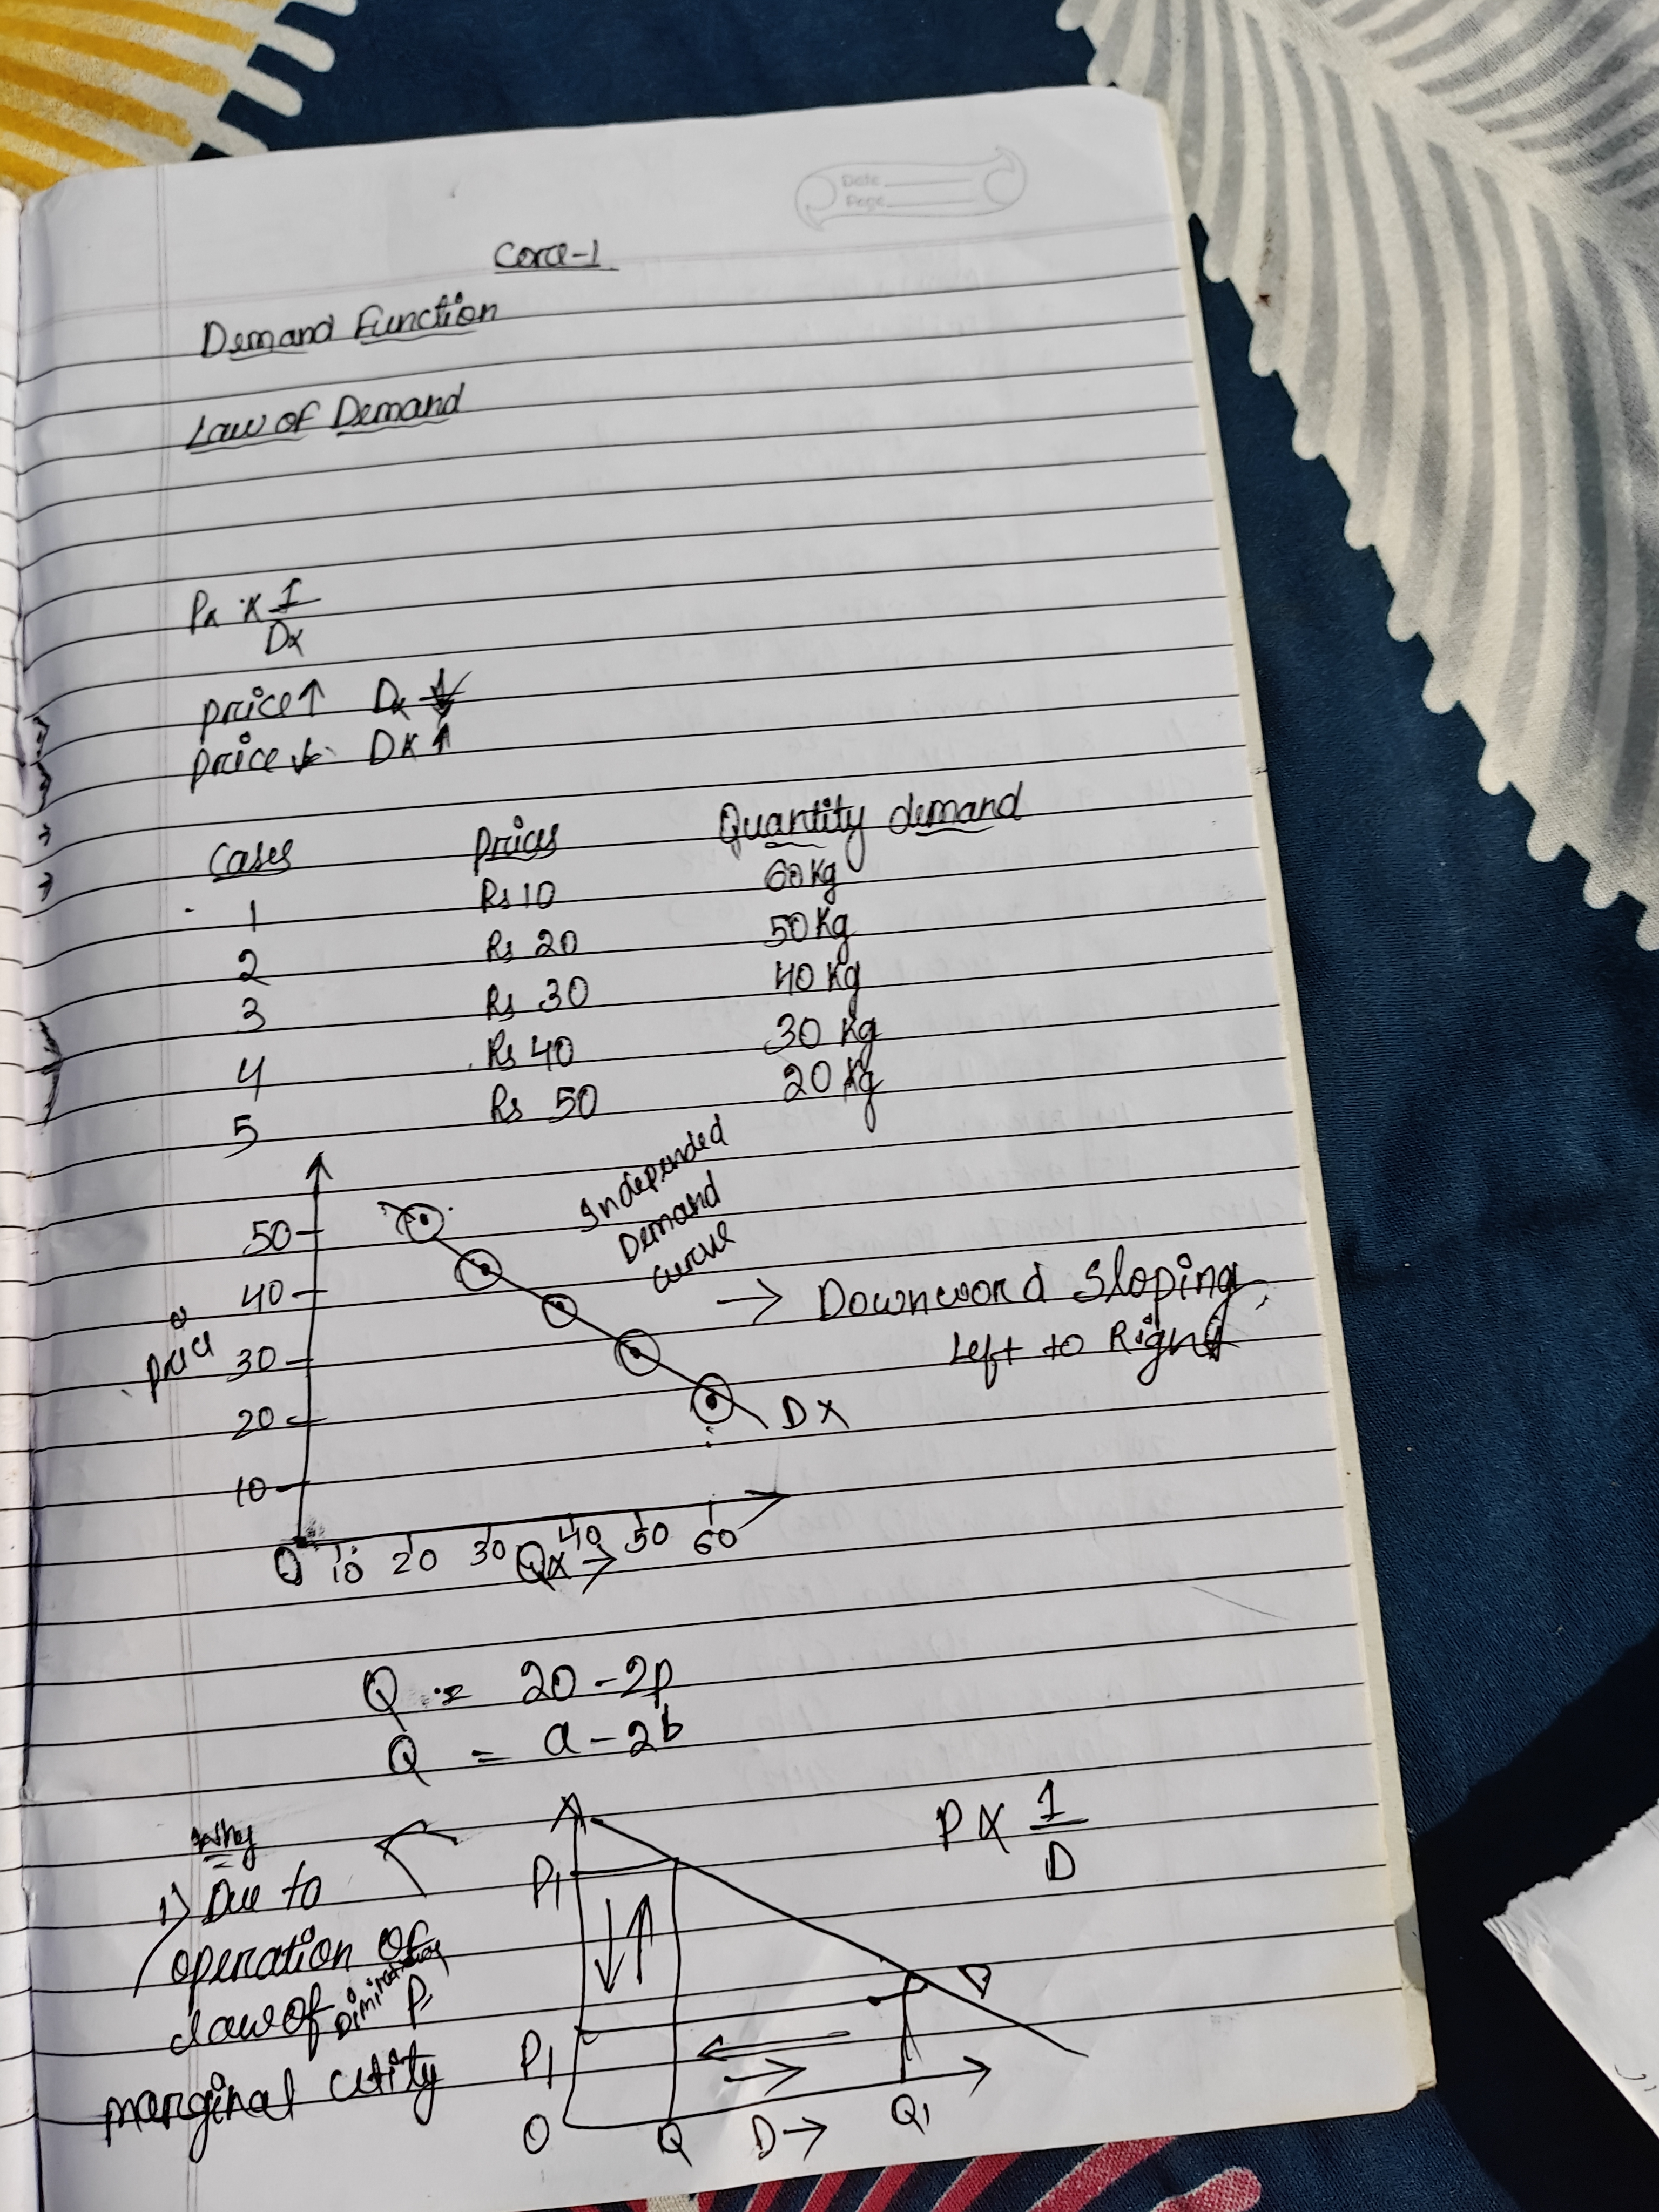
The image contains notes about the demand function and the law of demand, including a table showing prices and quantities demanded, a graph illustrating the downward slope of the demand curve, and equations representing the relationship between price and quantity demanded.
Answer
The law of demand is depicted by a downward-sloping demand curve.
The final answer is the law of demand is depicted by a downward-sloping demand curve, illustrating the inverse relationship between price and quantity demanded.
Answer for screen readers
The final answer is the law of demand is depicted by a downward-sloping demand curve, illustrating the inverse relationship between price and quantity demanded.
More Information
The demand function Q = a - bP is a simplified linear representation, where 'a' represents the quantity demanded when the price is zero, and 'b' represents how much quantity demanded decreases as price increases by one unit.
Tips
Common mistakes include confusing the demand curve with the supply curve (which slopes upward) and not considering the ceteris paribus condition (holding all else equal).
Sources
- What Is the Law of Demand in Economics, and How Does It Work? - investopedia.com
- Law of demand (article) | Demand - Khan Academy - khanacademy.org
- Law of Demand - Definition, Graph, Uses, Exceptions - corporatefinanceinstitute.com
AI-generated content may contain errors. Please verify critical information