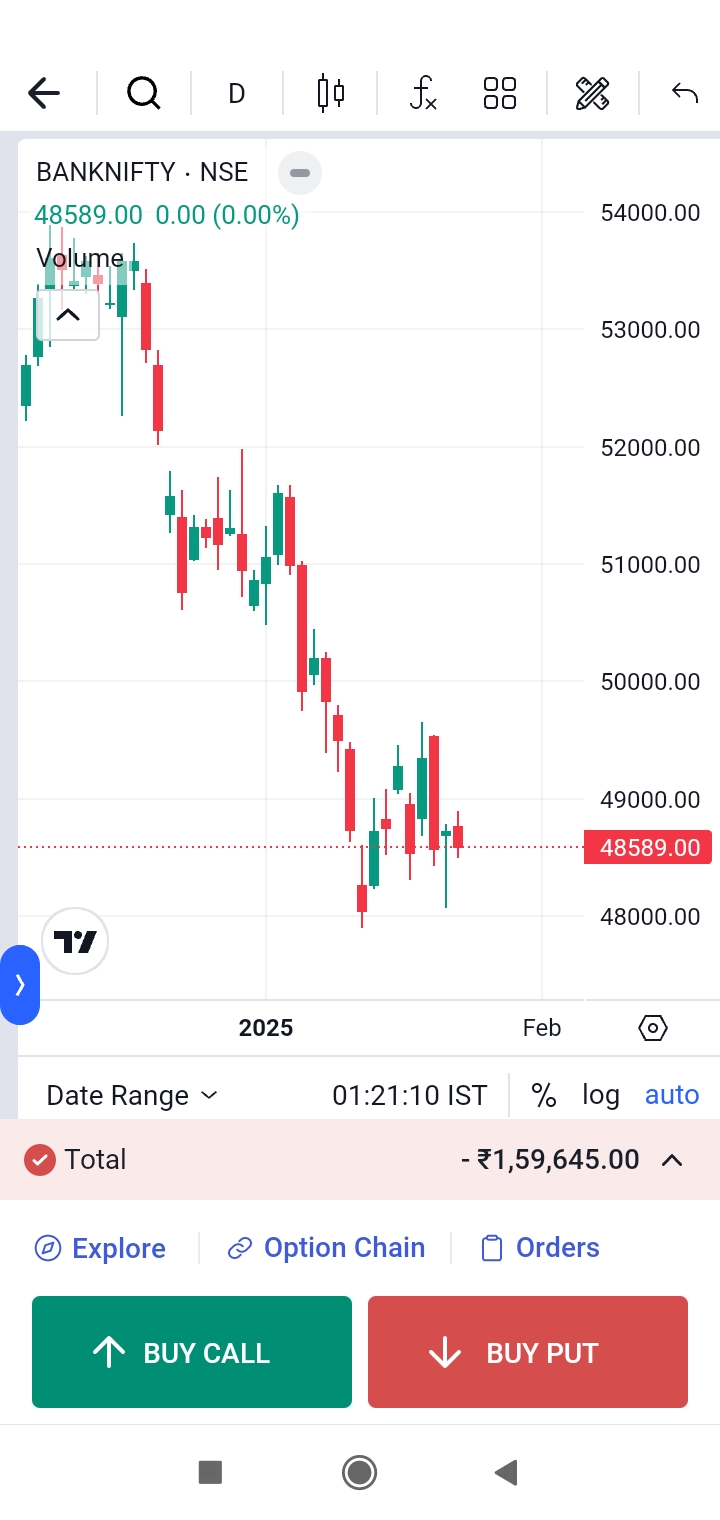
What does this stock chart indicate about the Bank Nifty index?

Understand the Problem
The question seems to involve analyzing a stock market chart for the Bank Nifty index, possibly looking for insights or predictions about market trends and trading options.
Answer
Downward trend, bearish sentiment.
The chart indicates a downward trend in the Bank Nifty index, suggesting bearish market sentiment.
Answer for screen readers
The chart indicates a downward trend in the Bank Nifty index, suggesting bearish market sentiment.
More Information
The chart shows a series of red candles, which typically indicates a decreasing price trend. This suggests that traders may be bearish about the Bank Nifty index.
Tips
A common mistake is misinterpreting candlestick patterns—ensure you understand the difference between bullish and bearish signals.
Sources
- Nifty Bank Technical Analysis and Moving Averages - Investing.com - investing.com
- What Are the Nifty Charts | Understanding Patterns & Candlestick ... - enrichmoney.in
AI-generated content may contain errors. Please verify critical information