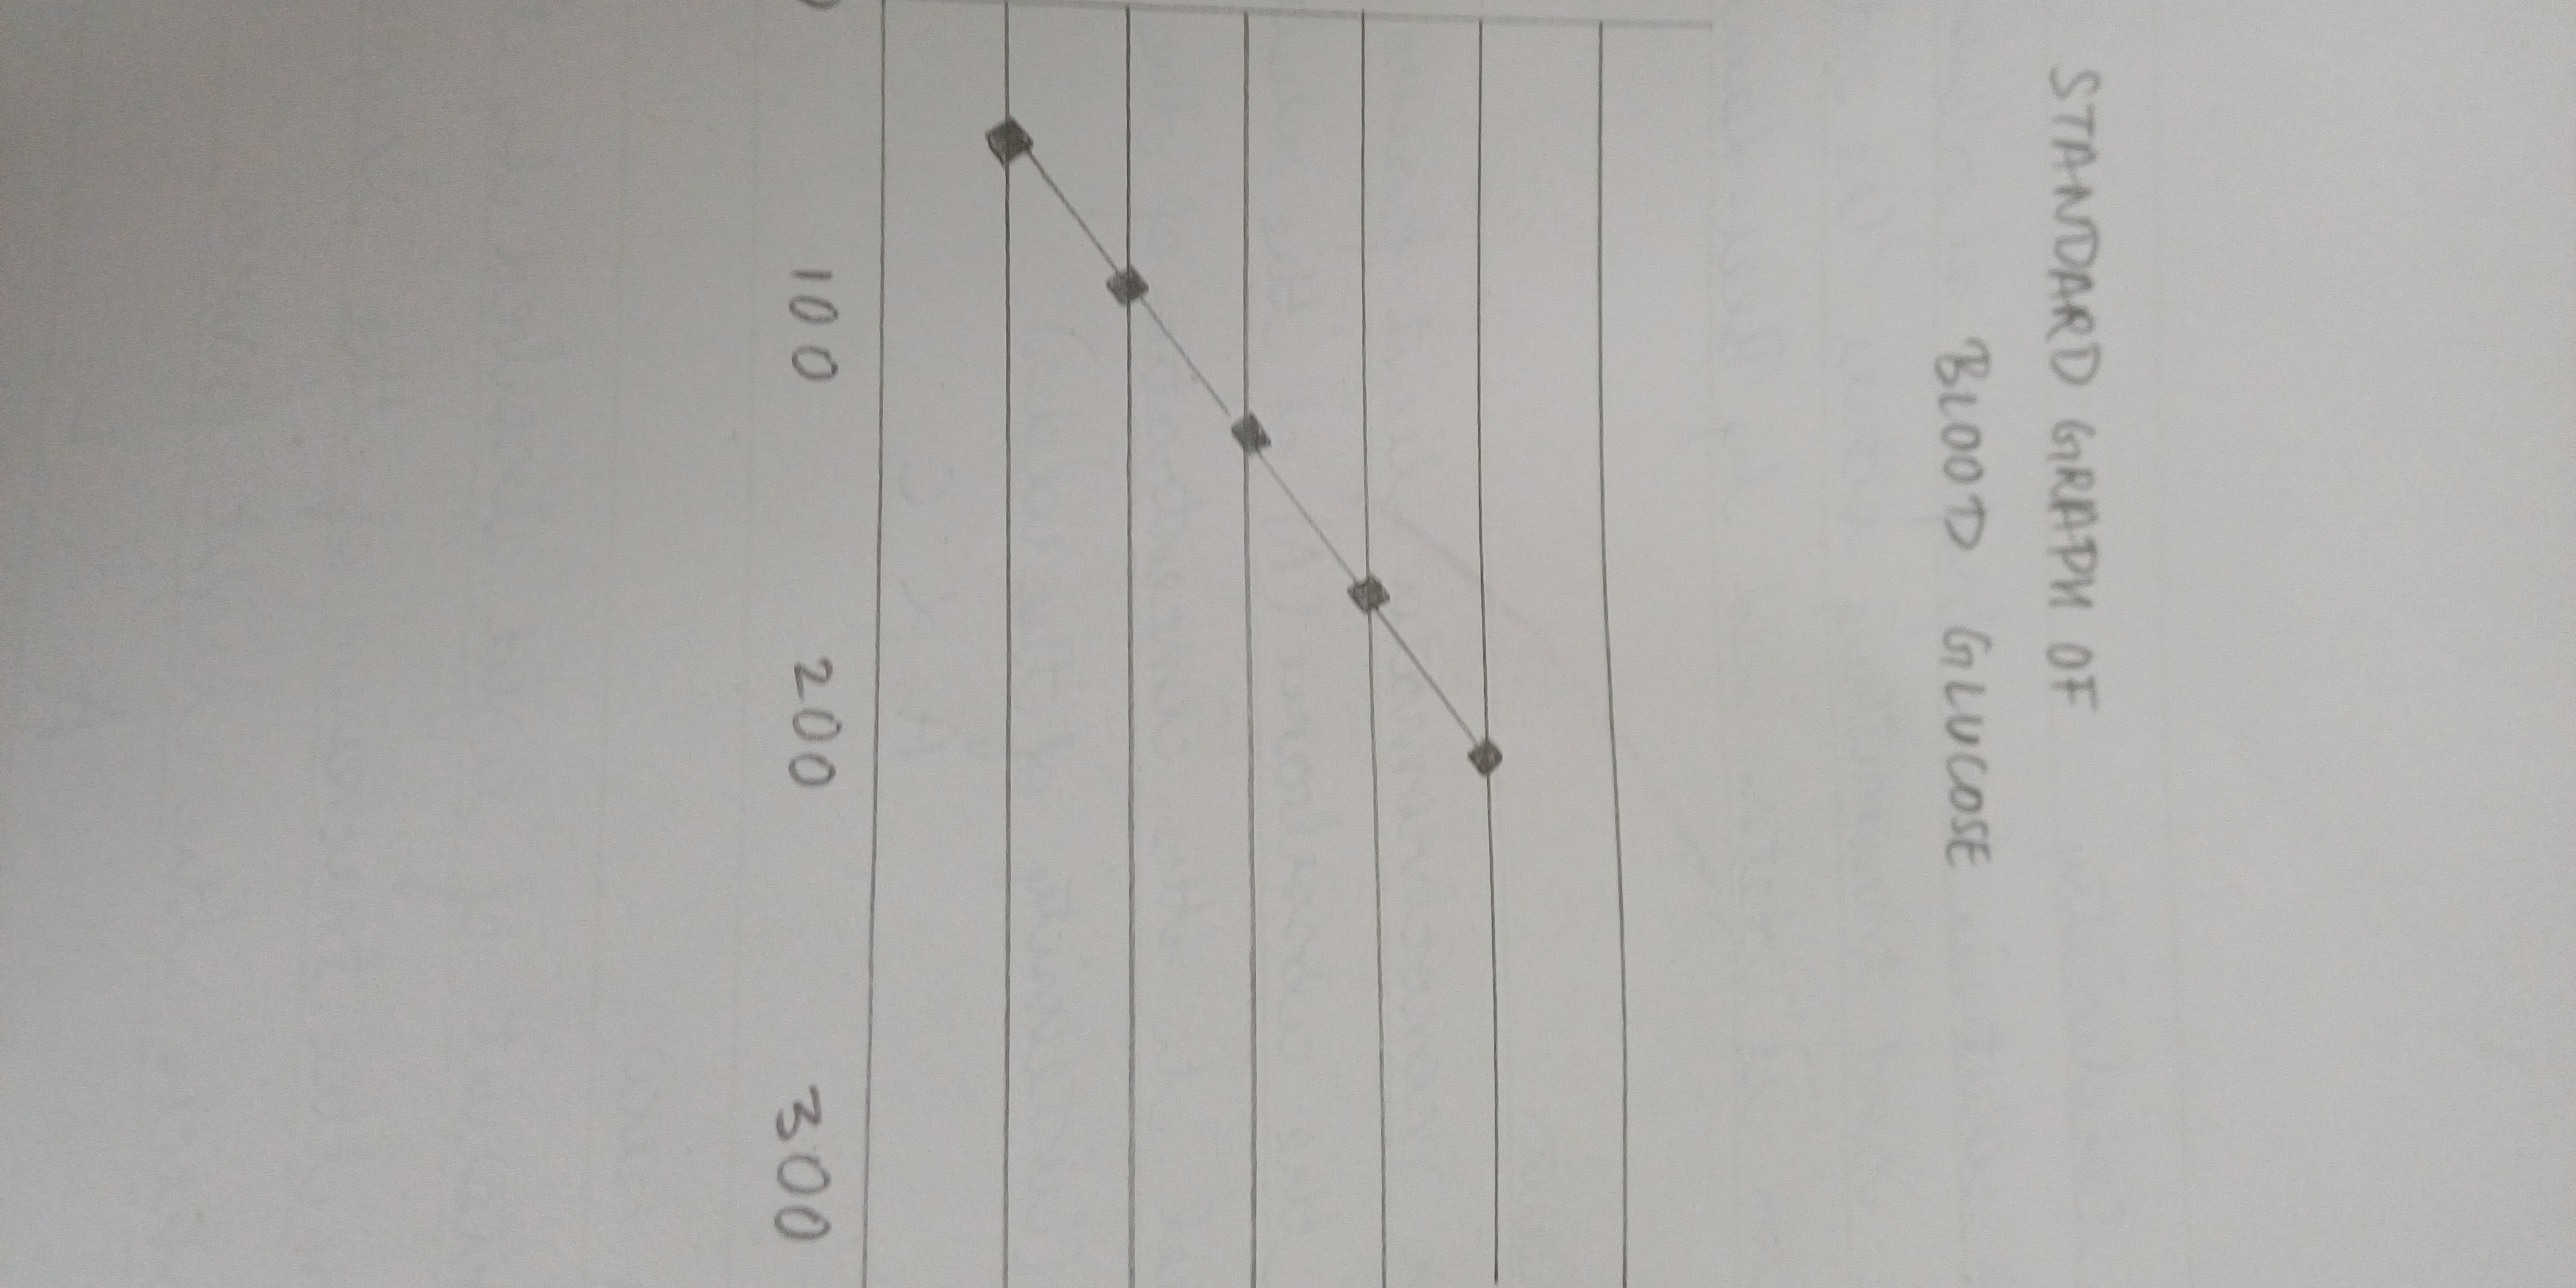
What does the standard graph of blood glucose demonstrate?
Understand the Problem
The question appears to involve a graph related to blood glucose levels, likely asking for analysis or information related to the data presented in the graph.
Answer
Changes in blood glucose over time.
A standard graph of blood glucose concentration usually shows changes over time, highlighting fluctuations due to factors like meals and activity.
Answer for screen readers
A standard graph of blood glucose concentration usually shows changes over time, highlighting fluctuations due to factors like meals and activity.
More Information
These graphs help in understanding how different factors like diet, exercise, and stress affect blood glucose levels.
Sources
- Blood glucose graphs - studymind.co.uk
- Glucose Curves Explained - helloinside.com
- Everything You Should Know About the Glucose Curve - nutrisense.io
AI-generated content may contain errors. Please verify critical information
Thank you for voting!