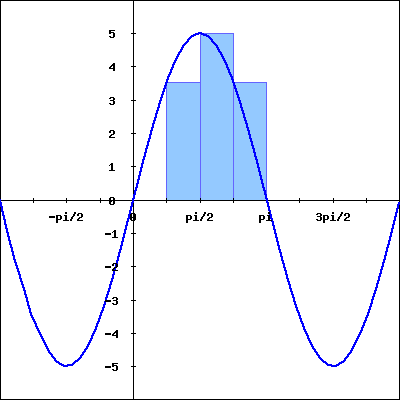
What does the graph of the sine function depicted here represent?

Understand the Problem
The question is asking about the interpretation of a graph that depicts a sine function along with some shaded areas. The focus may be on the properties or calculations related to this function.
Answer
The area is $1$.
Answer for screen readers
The area under the sine function from $0$ to $\frac{\pi}{2}$ is $1$.
Steps to Solve
- Identify Key Features of the Graph
In the given graph, we see a sine function plotted, denoted by $y = \sin(x)$. The key points of interest include the peaks and troughs, specifically at $x = \frac{\pi}{2}$ (maximum point), $x = \frac{3\pi}{2}$ (minimum point), and $x = -\frac{\pi}{2}$ (minimum point).
- Understand the Shaded Areas
The blue shaded areas represent the area under the curve of the sine function between specific limits. To find the shaded area, we need to calculate the definite integral of the sine function over those intervals.
- Calculate the Area under the Curve
For the intervals indicated by the shaded areas, we need to set up the integral. If the shaded area occurs from $x = 0$ to $x = \frac{\pi}{2}$, we compute:
$$ \text{Area} = \int_0^{\frac{\pi}{2}} \sin(x) , dx $$
- Evaluate the Integral
To evaluate the integral:
$$ \int \sin(x) , dx = -\cos(x) + C $$
Thus,
$$ \text{Area} = \left[-\cos(x)\right]_0^{\frac{\pi}{2}} = -\cos\left(\frac{\pi}{2}\right) - (-\cos(0)) = 0 + 1 = 1 $$
- Interpret the Result
The area under the sine function from $0$ to $\frac{\pi}{2}$ is equal to 1. This indicates the total area of the first shaded region.
The area under the sine function from $0$ to $\frac{\pi}{2}$ is $1$.
More Information
The sine function oscillates between -1 and 1 and is commonly used in trigonometry to model wave-like phenomena. Understanding the area under the sine curve is crucial in various applications, especially in physics and engineering.
Tips
- Misidentifying the Interval: Be careful to identify the correct limits of integration.
- Ignoring the Negative Area: In some cases, if the function dips below the x-axis, the area calculated may need to be taken as positive.
- Confusion with Function Values: Remember that the sine function has a specific range; always check the values after integration.
AI-generated content may contain errors. Please verify critical information