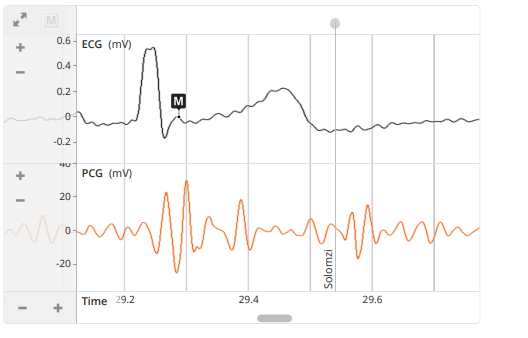
What do the ECG and PCG graphs indicate?

Understand the Problem
The question seems to ask for analysis or interpretation of the ECG and PCG waveforms displayed in the image, likely focusing on specific features or events indicated on the graphs.
Answer
ECG shows electrical heart activity; PCG shows heart sounds.
The ECG graph indicates electrical activity of the heart, while the PCG graph indicates mechanical sounds from the heart. Both are used to detect cardiovascular issues.
Answer for screen readers
The ECG graph indicates electrical activity of the heart, while the PCG graph indicates mechanical sounds from the heart. Both are used to detect cardiovascular issues.
More Information
ECG measures the heart's electrical signals represented by waves; PCG captures sounds like beats and murmurs. Joint analysis helps in detecting heart abnormalities.
Tips
Avoid confusing the two graphs: ECG relates to electrical signals while PCG focuses on sound waves.
Sources
- Heart Abnormality Classification Using PCG and ECG Recordings - scielo.org.mx
- Phonocardiography - an overview - sciencedirect.com
- Correlation between ECG and PCG - researchgate.net
AI-generated content may contain errors. Please verify critical information