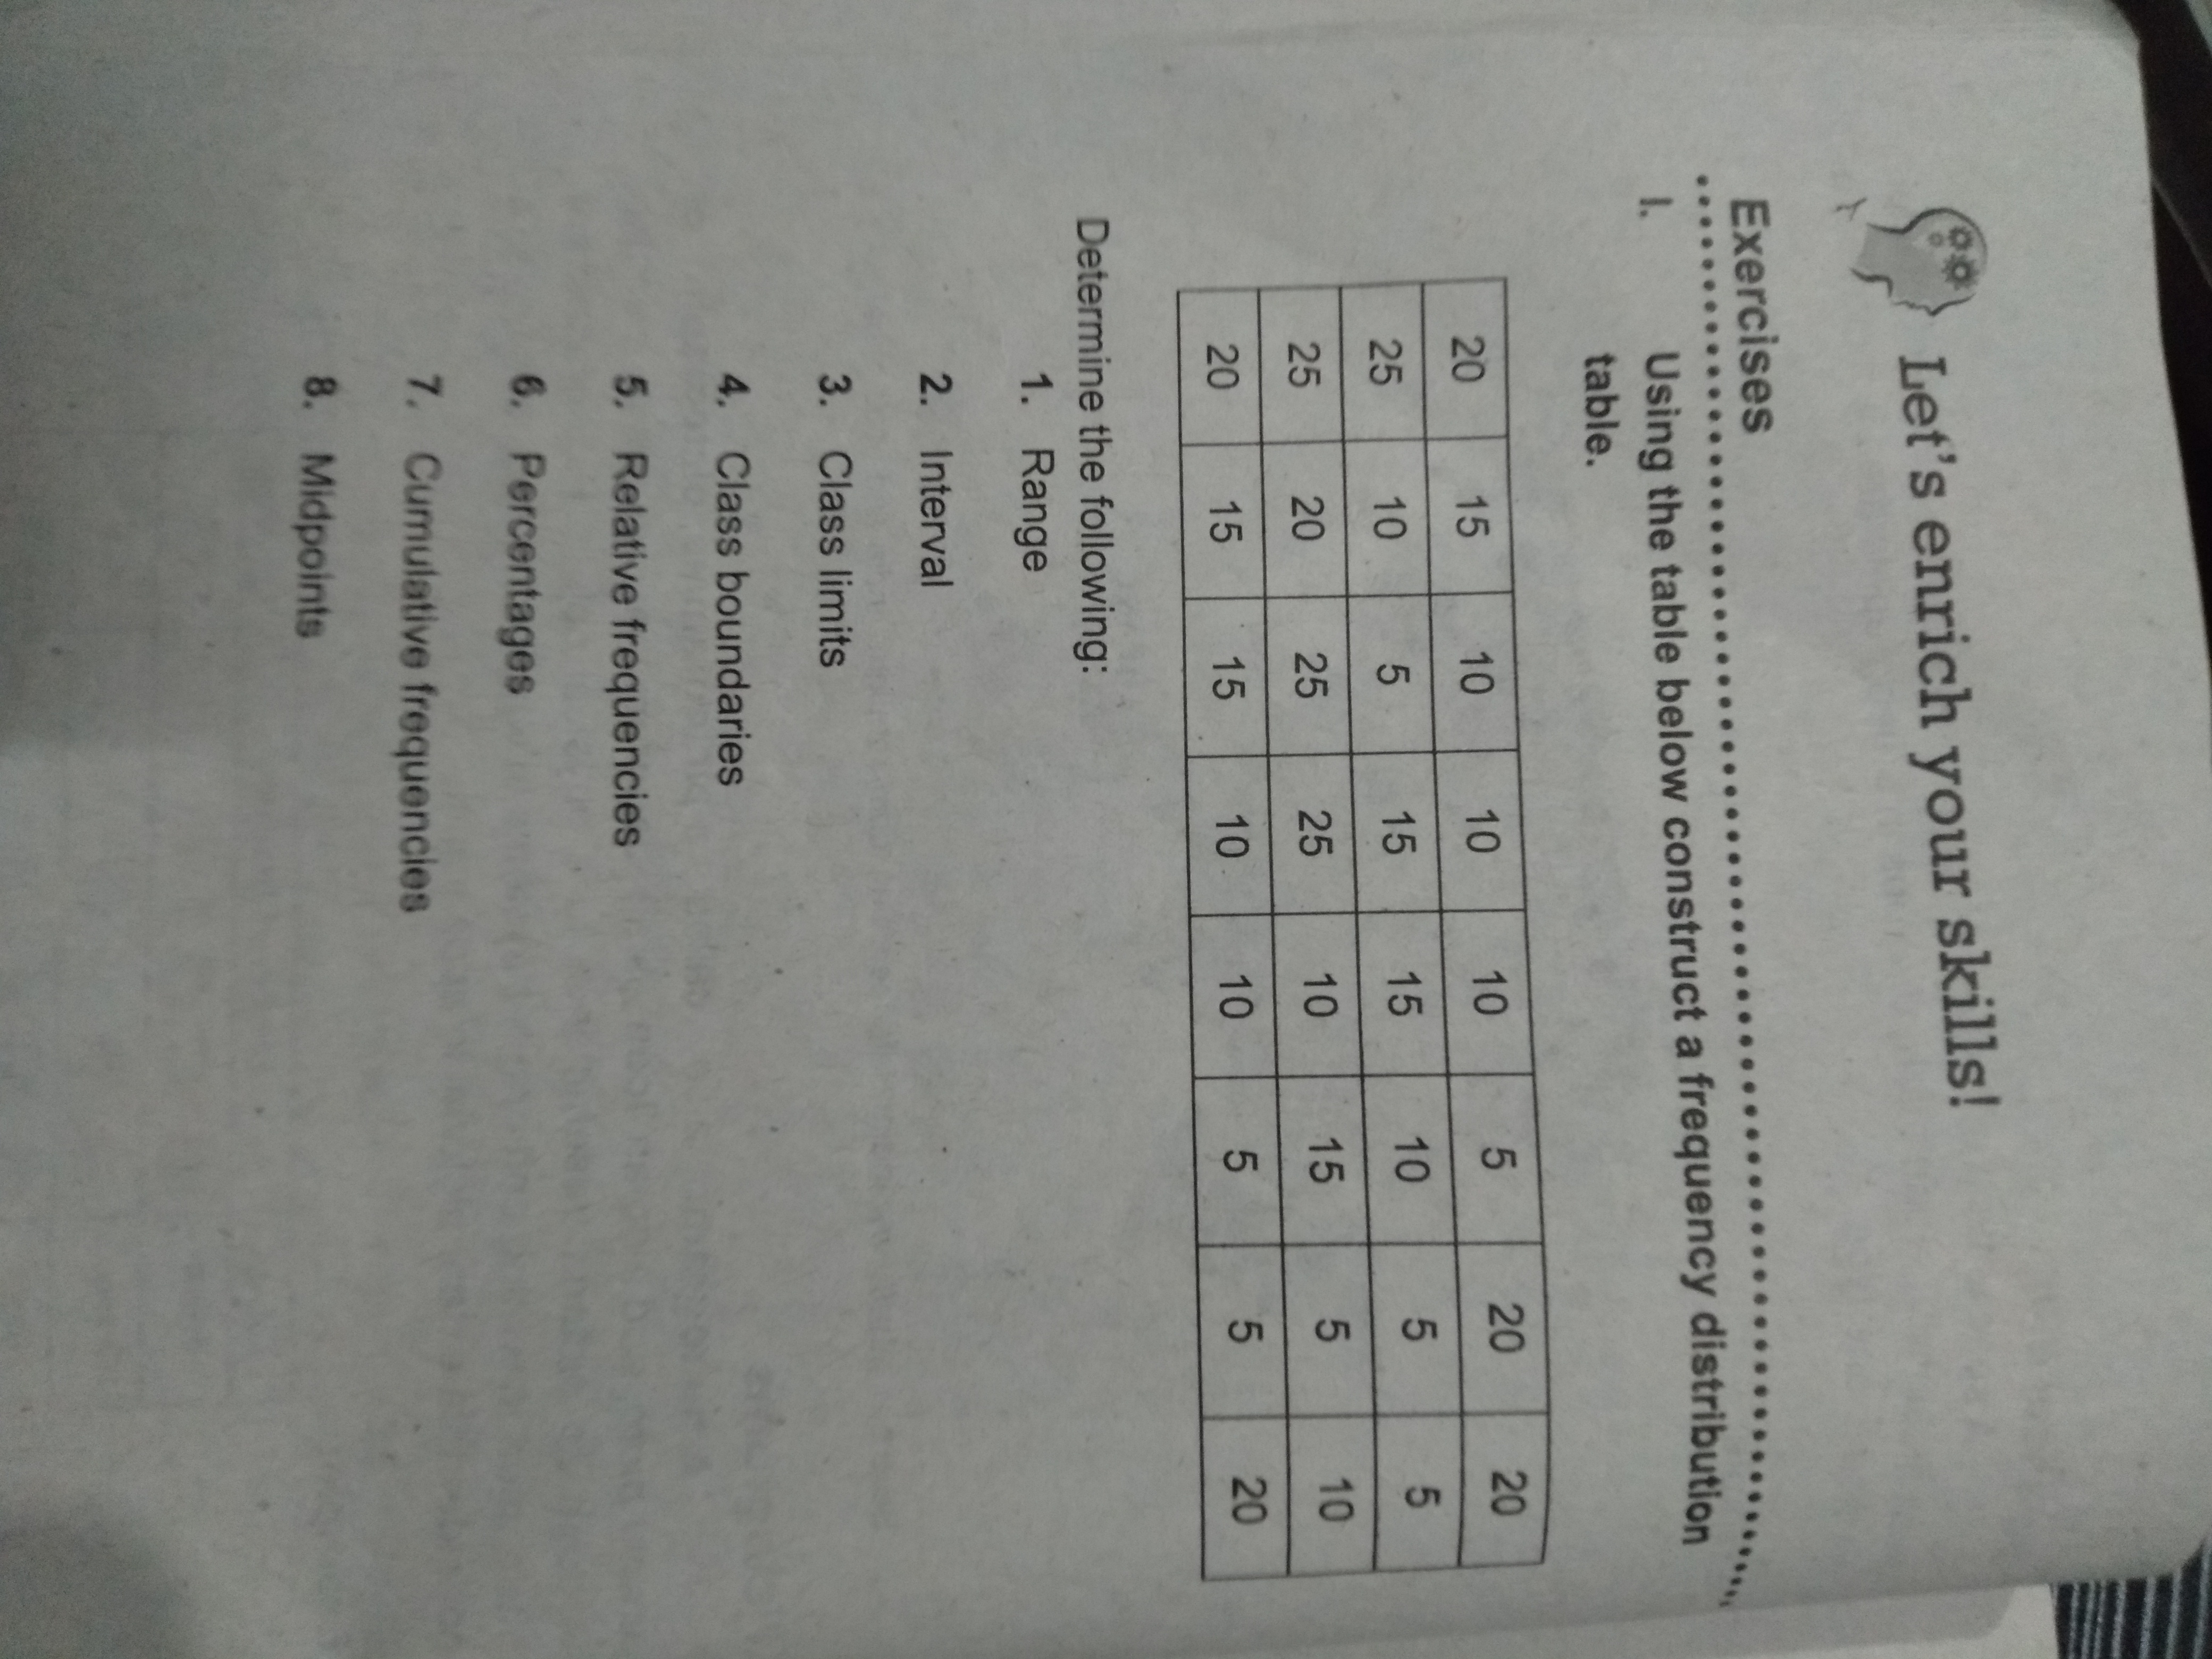
Using the table below, construct a frequency distribution table. Determine the following: 1. Range 2. Interval 3. Class limits 4. Class boundaries 5. Relative frequencies 6. Percen... Using the table below, construct a frequency distribution table. Determine the following: 1. Range 2. Interval 3. Class limits 4. Class boundaries 5. Relative frequencies 6. Percentages 7. Cumulative frequencies 8. Midpoints.

Understand the Problem
The question is asking for the construction of a frequency distribution table based on the provided data. It includes determining range, interval, class limits, class boundaries, relative frequencies, cumulative frequencies, percentages, and midpoints.
Answer
The range is 20; intervals are 4; class limits are 5-8, 9-12, 13-16, 17-20, 21-24, 25-28; boundaries are 4.5, 28.5; relative frequencies are 0.25, 0.30, 0.20, 0.25, 0.00, 0.00; cumulative frequencies are 5, 11, 15, 20, 20, 20; percentages are 25%, 30%, 20%, 25%, 0%, 0%; midpoints are 6.5, 10.5, 14.5, 18.5, 22.5, 26.5.
Answer for screen readers
Frequency Distribution Table
| Class Limits | Frequency | Relative Frequency | Cumulative Frequency | Percentage | Midpoint |
|---|---|---|---|---|---|
| 5 - 8 | 5 | 0.25 | 5 | 25% | 6.5 |
| 9 - 12 | 6 | 0.30 | 11 | 30% | 10.5 |
| 13 - 16 | 4 | 0.20 | 15 | 20% | 14.5 |
| 17 - 20 | 5 | 0.25 | 20 | 25% | 18.5 |
| 21 - 24 | 0 | 0.00 | 20 | 0% | 22.5 |
| 25 - 28 | 0 | 0.00 | 20 | 0% | 26.5 |
Steps to Solve
-
Determine the Range The range is calculated as the difference between the highest and lowest values in the data set.
- Highest value: 25
- Lowest value: 5
- Range = Highest - Lowest = $25 - 5 = 20$
-
Determine the Number of Classes Generally, the number of classes (k) can be calculated using Sturges' formula: $$ k = 1 + 3.322 \log_{10}(n) $$ where ( n ) is the number of observations.
- Here, ( n = 20 )
- Therefore, ( k \approx 1 + 3.322 \log_{10}(20) = 5.32 ) (round up to 6 classes)
-
Calculate the Interval Width The interval width can be found using the formula: $$ \text{Interval Width} = \frac{\text{Range}}{k} = \frac{20}{6} \approx 3.33 $$ Rounding up to the next whole number gives an interval width of 4.
-
Determine Class Limits and Boundaries Starting from the lowest value (5), the classes can be constructed as follows:
- Class 1: 5 - 8
- Class 2: 9 - 12
- Class 3: 13 - 16
- Class 4: 17 - 20
- Class 5: 21 - 24
- Class 6: 25 - 28
Class boundaries can be defined as:
- Lower boundary of Class 1: 4.5
- Upper boundary of Class 6: 28.5
-
Tally the Frequencies Count how many data points fall within each class:
- Class 1 (5-8): 5 occurrences
- Class 2 (9-12): 6 occurrences
- Class 3 (13-16): 4 occurrences
- Class 4 (17-20): 5 occurrences
- Class 5 (21-24): 0 occurrences
- Class 6 (25-28): 0 occurrences
-
Calculate Relative Frequencies The relative frequency is calculated by dividing the frequency of each class by the total number of observations (20):
- Relative Frequency = $\frac{\text{Frequency}}{n}$
- Class 1: $\frac{5}{20} = 0.25$
- Class 2: $\frac{6}{20} = 0.30$
- Class 3: $\frac{4}{20} = 0.20$
- Class 4: $\frac{5}{20} = 0.25$
- Class 5: $\frac{0}{20} = 0.00$
- Class 6: $\frac{0}{20} = 0.00$
-
Calculate Cumulative Frequencies Cumulative frequency is the sum of the frequencies for each class and all previous classes:
- Class 1: 5
- Class 2: 5 + 6 = 11
- Class 3: 11 + 4 = 15
- Class 4: 15 + 5 = 20
- Class 5: 20 + 0 = 20
- Class 6: 20 + 0 = 20
-
Calculate Percentages Percentage is calculated by multiplying the relative frequency by 100:
- Class 1: $0.25 \times 100 = 25%$
- Class 2: $0.30 \times 100 = 30%$
- Class 3: $0.20 \times 100 = 20%$
- Class 4: $0.25 \times 100 = 25%$
- Class 5: $0.00 \times 100 = 0%$
- Class 6: $0.00 \times 100 = 0%$
-
Calculate Midpoints of Each Class The midpoint is calculated by averaging the class limits:
- Class 1: $\frac{5 + 8}{2} = 6.5$
- Class 2: $\frac{9 + 12}{2} = 10.5$
- Class 3: $\frac{13 + 16}{2} = 14.5$
- Class 4: $\frac{17 + 20}{2} = 18.5$
- Class 5: $\frac{21 + 24}{2} = 22.5$
- Class 6: $\frac{25 + 28}{2} = 26.5$
Frequency Distribution Table
| Class Limits | Frequency | Relative Frequency | Cumulative Frequency | Percentage | Midpoint |
|---|---|---|---|---|---|
| 5 - 8 | 5 | 0.25 | 5 | 25% | 6.5 |
| 9 - 12 | 6 | 0.30 | 11 | 30% | 10.5 |
| 13 - 16 | 4 | 0.20 | 15 | 20% | 14.5 |
| 17 - 20 | 5 | 0.25 | 20 | 25% | 18.5 |
| 21 - 24 | 0 | 0.00 | 20 | 0% | 22.5 |
| 25 - 28 | 0 | 0.00 | 20 | 0% | 26.5 |
More Information
The table summarizes how data can be grouped into classes, facilitating interpretation of distributions. It allows for a clear view of frequencies, relative frequencies, cumulative frequencies, percentages, and midpoints, which are crucial in statistical analysis.
Tips
- Miscounting Frequencies: It's easy to miscount frequencies when arranging data into classes. Always double-check your tallies.
- Mistaking Boundaries as Class Limits: Ensure that you understand the difference between class limits and boundaries. Class boundaries help prevent ambiguity at the edges.
- Incorrect Calculation of Relative Frequencies: Make sure to divide the frequency of each class by the total number of observations accurately.
AI-generated content may contain errors. Please verify critical information