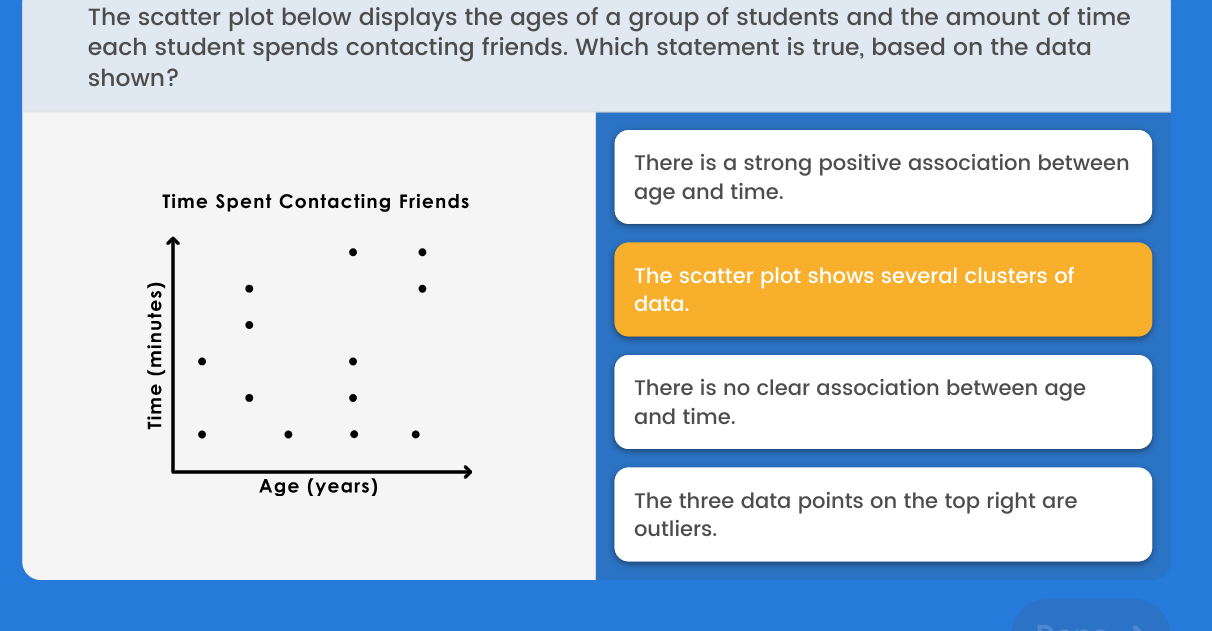
The scatter plot below displays the ages of a group of students and the amount of time each student spends contacting friends. Which statement is true, based on the data shown?

Understand the Problem
The question is asking which statement accurately describes the relationships or patterns observed in a scatter plot that represents the ages of students and their time spent contacting friends. The goal is to interpret the data shown in the plot to find the correct statement.
Answer
The scatter plot shows several clusters of data.
The scatter plot shows several clusters of data.
Answer for screen readers
The scatter plot shows several clusters of data.
More Information
The scatter plot appears to be composed of groups or clusters of data points rather than showing a clear direction or pattern.
Tips
Ensure to look for patterns or clusters in scatter plots to accurately interpret data distributions.
Sources
AI-generated content may contain errors. Please verify critical information