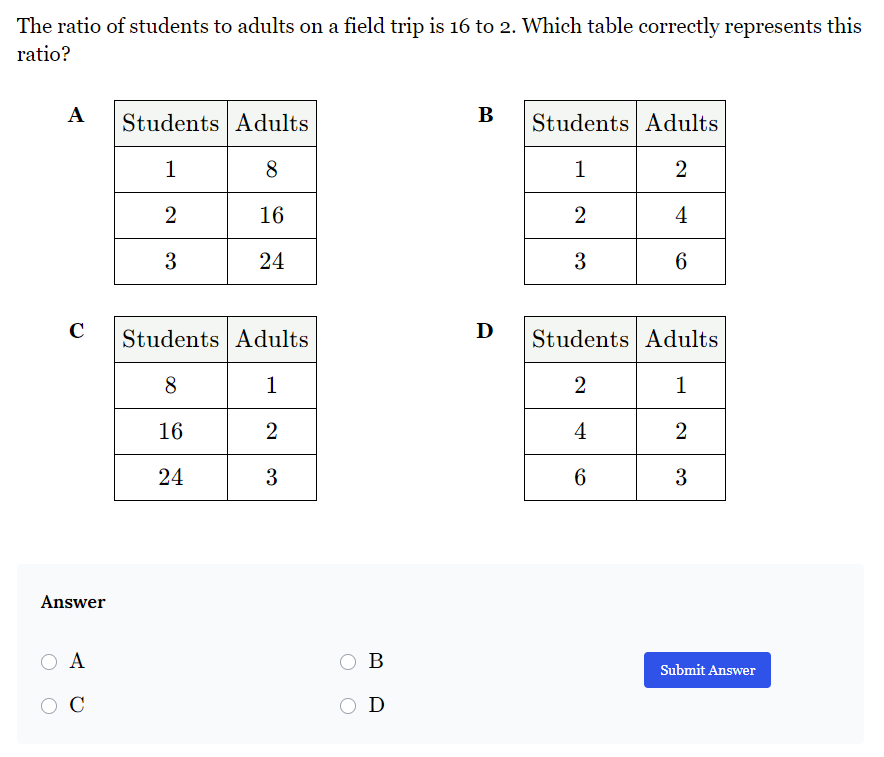
The ratio of students to adults on a field trip is 16 to 2. Which table correctly represents this ratio?

Understand the Problem
The question is asking to identify which table correctly represents the ratio of students to adults given as 16 to 2. The goal is to evaluate the four options provided and determine which one accurately reflects this ratio.
Answer
C
Answer for screen readers
C
Steps to Solve
-
Understanding the Ratio The given ratio of students to adults is 16 to 2. This can be simplified by dividing both parts by 2, yielding a ratio of 8 to 1.
-
Calculating Ratios for Each Table We will check each table to see if it maintains the simplified ratio of 8 students for every 1 adult.
-
Table A Evaluation For Table A:
- Ratio:
- 1 student : 8 adults → $1/8 = 0.125$
- 2 students : 16 adults → $2/16 = 0.125$
- 3 students : 24 adults → $3/24 = 0.125$
None match the required ratio of $8/1 = 8$.
- Table B Evaluation For Table B:
- Ratio:
- 1 student : 2 adults → $1/2 = 0.5$
- 2 students : 4 adults → $2/4 = 0.5$
- 3 students : 6 adults → $3/6 = 0.5$
None match the required ratio of $8/1 = 8$.
- Table C Evaluation For Table C:
- Ratio:
- 8 students : 1 adult → $8/1 = 8$
- 16 students : 2 adults → $16/2 = 8$
- 24 students : 3 adults → $24/3 = 8$
All match the required ratio of $8/1 = 8$.
- Table D Evaluation For Table D:
- Ratio:
- 2 students : 1 adult → $2/1 = 2$
- 4 students : 2 adults → $4/2 = 2$
- 6 students : 3 adults → $6/3 = 2$
None match the required ratio of $8/1 = 8$.
- Conclusion Only Table C consistently demonstrates the correct ratio of students to adults.
C
More Information
Table C accurately reflects the student-to-adult ratio of 16 to 2 (or simplified to 8 to 1) by maintaining this ratio across all entries in the table.
Tips
- Failing to simplify the ratio correctly before comparing.
- Misreading the entries in the tables/test ratios.
- Not applying the ratio consistently across the sizes in tables.
AI-generated content may contain errors. Please verify critical information