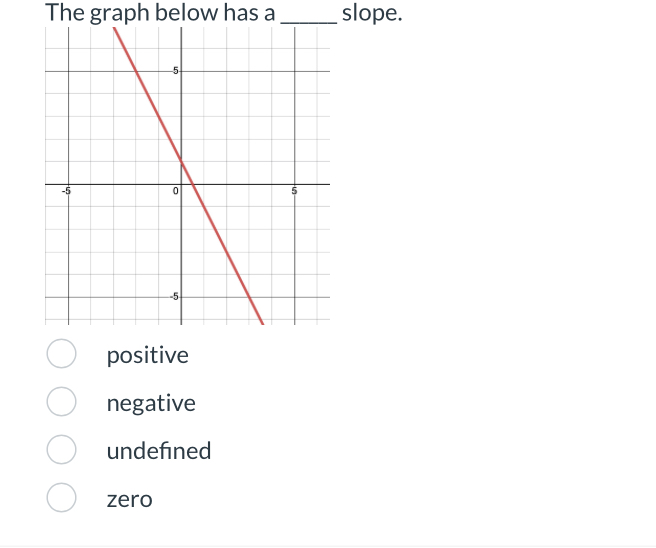
The graph below has a _____ slope.

Understand the Problem
The question is asking about the slope of the line represented in the graph. The answer will depend on the direction in which the line is sloping.
Answer
negative
Answer for screen readers
The graph below has a negative slope.
Steps to Solve
-
Identify the direction of the line Look at the graph and see how the red line is oriented. If the line rises from left to right, it has a positive slope. If it falls from left to right, it has a negative slope.
-
Examine the graph In this case, the line is sloping downward. This means for each step you take to the right on the x-axis, the line moves down on the y-axis.
-
Determine the slope type Since the line is falling, we determine that the slope is negative, as it descends from higher y-values to lower y-values as you move along the x-axis.
The graph below has a negative slope.
More Information
A negative slope indicates that as you move from left to right on the graph, the line decreases in height. This is often seen in relationships where an increase in one variable results in a decrease in another.
Tips
Common mistakes include misinterpreting the direction of the slope, especially if one is not familiar with graphing. To avoid this, always trace the line from left to right to observe if it rises or falls.
AI-generated content may contain errors. Please verify critical information