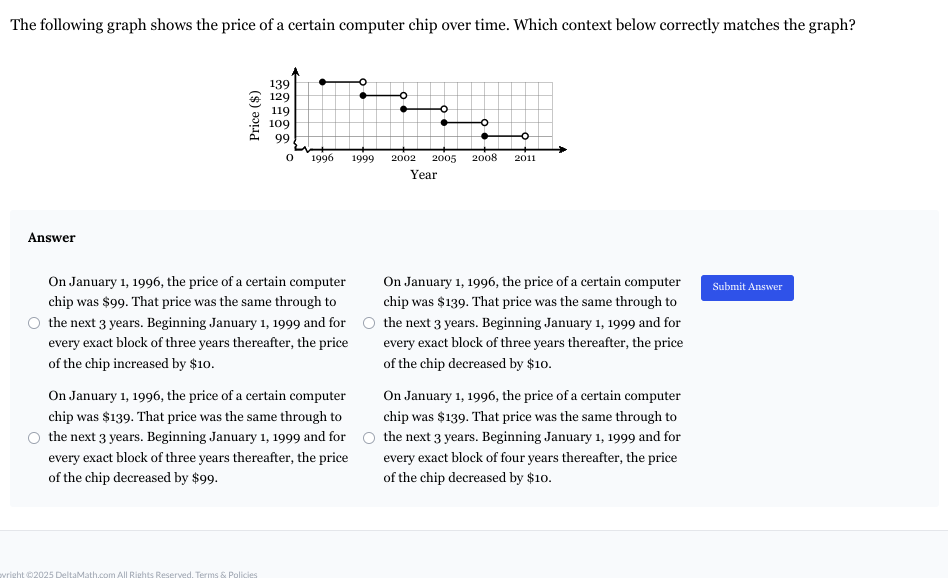
The following graph shows the price of a certain computer chip over time. Which context below correctly matches the graph?
Understand the Problem
The question is asking for the correct context that matches a provided graph showing the price of a computer chip over time. The graph likely illustrates specific price changes at intervals, and the user must identify which of the answer options accurately reflects this information.
Answer
1996 price $139, decreases $10 every 3 years.
The context: 'On January 1, 1996, the price of a certain computer chip was $139. That price was the same through to the next 3 years. Beginning January 1, 1999 and for every exact block of three years thereafter, the price of the chip decreased by $10.' matches the graph.
Answer for screen readers
The context: 'On January 1, 1996, the price of a certain computer chip was $139. That price was the same through to the next 3 years. Beginning January 1, 1999 and for every exact block of three years thereafter, the price of the chip decreased by $10.' matches the graph.
More Information
The graph shows the price of the computer chip starting at $139 in 1996, staying constant for 3 years, and decreasing by $10 every 3 years thereafter.
Tips
Make sure to closely match the increments and decrements of prices across the given time intervals.
AI-generated content may contain errors. Please verify critical information