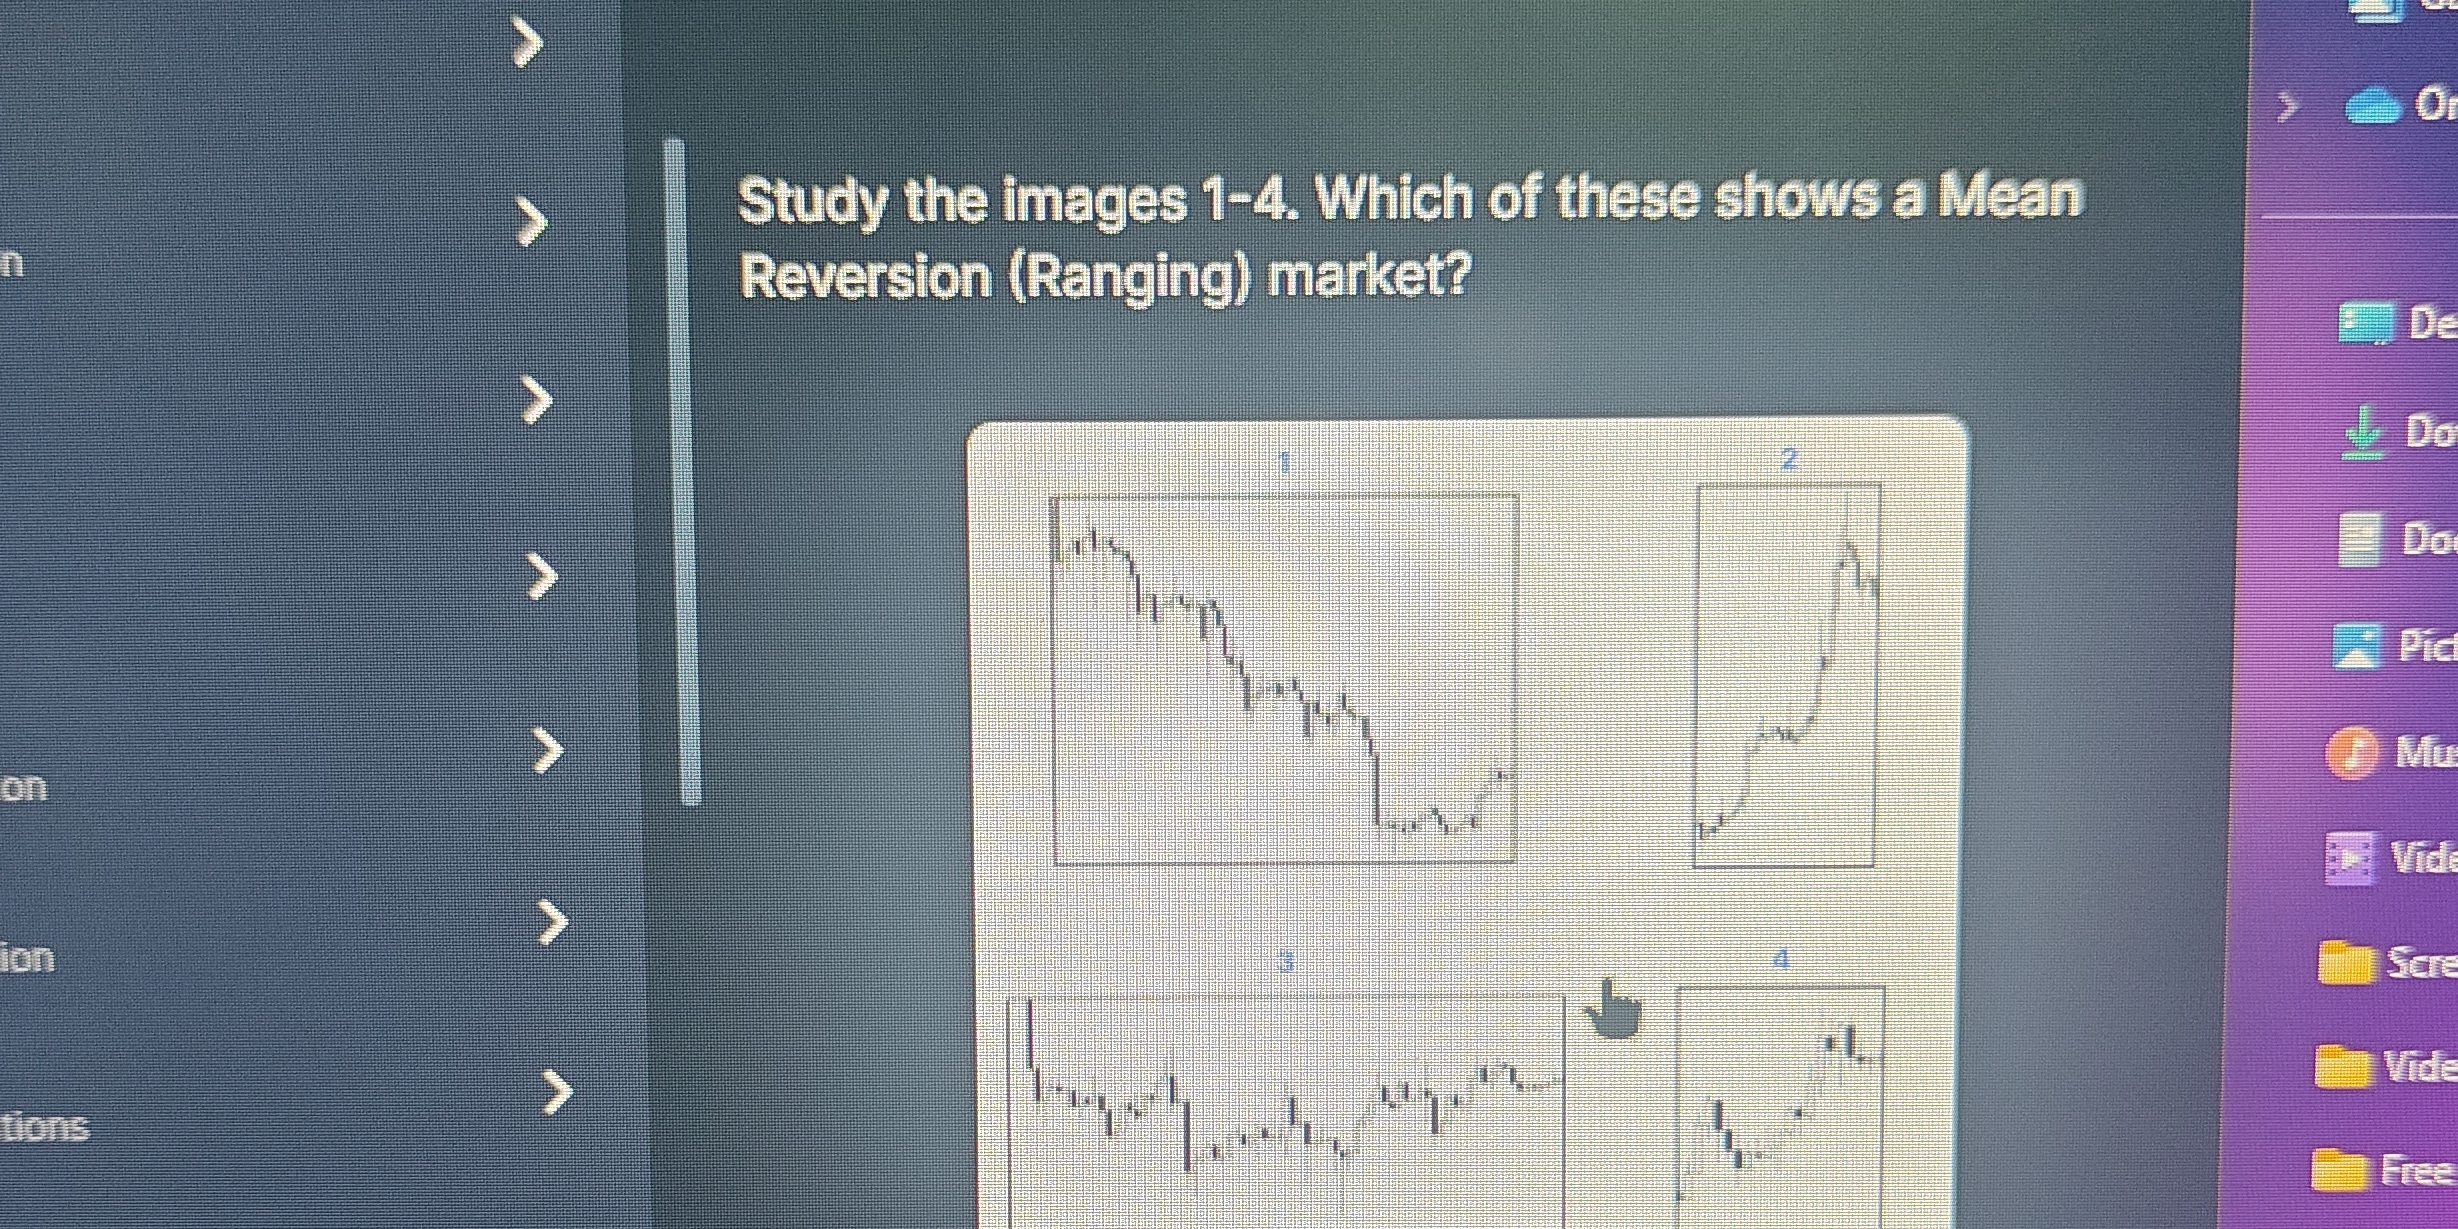
Study the images 1-4. Which of these shows a Mean Reversion (Ranging) market?

Understand the Problem
The question is asking to analyze four images and identify which one represents a Mean Reversion (Ranging) market. This requires knowledge of market patterns and trading terminology.
Answer
Image 3
The final answer is that Image 3 shows a Mean Reversion (Ranging) market.
Answer for screen readers
The final answer is that Image 3 shows a Mean Reversion (Ranging) market.
More Information
A ranging market is characterized by prices consistently moving between support and resistance levels, indicating a lack of trend.
Tips
Mistaking trends for ranging markets is common. Ensure that there is no overall upward or downward trend.
Sources
- Day 17 Mean Reversion Day 13 Study the Images - StudyX.AI - studyx.ai
- Range Trading And Mean Reversion - FasterCapital - fastercapital.com
AI-generated content may contain errors. Please verify critical information