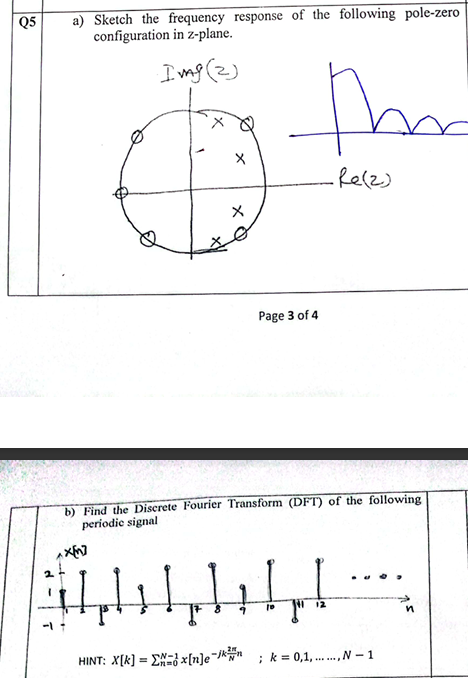
Sketch the frequency response of the following pole-zero configuration in z-plane. Find the Discrete Fourier Transform (DFT) of the following periodic signal.

Understand the Problem
The question is asking to sketch the frequency response for a given pole-zero configuration in the z-plane, and also to find the Discrete Fourier Transform (DFT) of a specified periodic signal. The first part requires knowledge of control systems and signal processing, while the second part focuses on calculating the DFT based on the given periodic signal.
Answer
The DFT is determined using $X[k] = \sum_{n=0}^{N-1} x[n] e^{-j\frac{2\pi}{N}kn}$, evaluating for each $k$. The frequency response is sketched considering the poles and zeros in the z-plane.
Answer for screen readers
For the DFT calculation of the periodic signal, the values of $X[k]$ will depend on the specific amplitudes of the signal given, which needs closer inspection of the provided plot. The sketch of the frequency response would typically exhibit characteristic shapes based on the poles and zeros.
Steps to Solve
-
Sketch the Frequency Response
To sketch the frequency response, identify the zeros (denoted by "o") and poles (denoted by "x") on the unit circle in the z-plane. The poles and zeros affect the frequency response significantly. The frequency response can often be visualized by substituting $z = e^{j\omega}$ where $\omega$ is the frequency.
-
Determine the Magnitude and Phase
Calculate the magnitude $|H(e^{j\omega})|$ and phase $\angle H(e^{j\omega})$ for the given configuration by evaluating the transfer function at different values of $\omega$. The formula for the frequency response is given by:
$$ H(e^{j\omega}) = \frac{Z(e^{j\omega})}{P(e^{j\omega})} $$
where $Z(e^{j\omega})$ is the product of the zeros and $P(e^{j\omega})$ is the product of the poles.
-
Analyze the Plot
Based on the zero and pole configuration, plot the magnitude and phase response on the Cartesian plane where the x-axis represents $\omega$ and the y-axis represents the magnitude and phase.
-
Finding the DFT of a Periodic Signal
The Discrete Fourier Transform (DFT) is defined as:
$$ X[k] = \sum_{n=0}^{N-1} x[n] e^{-j\frac{2\pi}{N}kn} $$
where $N$ is the number of samples and $k$ is the frequency index ranging from $0$ to $N-1$.
-
Apply the DFT to the Given Signal
Using the provided periodic signal, plug in the values for $x[n]$ and compute $X[k]$ for each value of $k$. Make sure to account for how many total samples $N$ there are, and adjust the equations accordingly.
-
Document the Results
Once both parts are computed and plotted, ensure the results are neatly documented, along with any notable observations regarding frequency components identified in the DFT.
For the DFT calculation of the periodic signal, the values of $X[k]$ will depend on the specific amplitudes of the signal given, which needs closer inspection of the provided plot. The sketch of the frequency response would typically exhibit characteristic shapes based on the poles and zeros.
More Information
The frequency response tells us how different frequency components are affected by a given system based on pole-zero analysis, while the DFT provides frequency domain representation for a discrete signal.
Tips
- Not correctly identifying poles and zeros can lead to incorrect frequency response sketches.
- Misapplying the DFT formula by either missing the summation limits or improperly evaluating the signal at those limits.
AI-generated content may contain errors. Please verify critical information