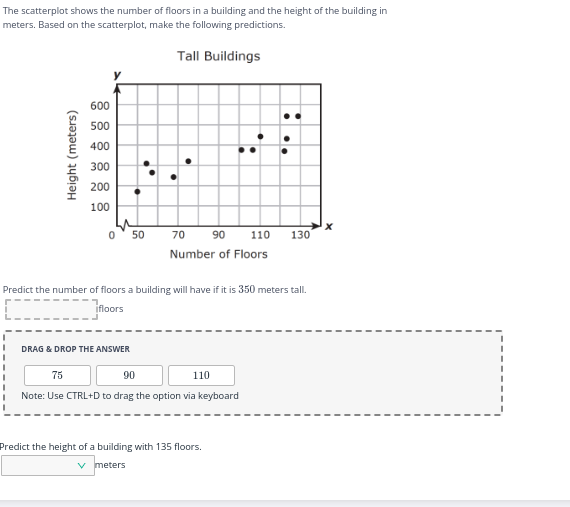
Predict the number of floors a building will have if it is 350 meters tall. Predict the height of a building with 135 floors.

Understand the Problem
The question is asking for predictions based on a provided scatterplot of building heights versus the number of floors. Specifically, it requires us to estimate the number of floors for a building with a height of 350 meters and the height of a building that has 135 floors.
Answer
For a building that is 350 meters tall, the predicted floors are $90$. For a building with $135$ floors, the predicted height is $525$ meters.
Answer for screen readers
For a building that is 350 meters tall, the predicted number of floors is approximately 90 floors.
For a building with 135 floors, the predicted height is approximately 525 meters.
Steps to Solve
- Identify Data Points on the Scatterplot
To predict the number of floors for a building with a height of 350 meters, locate where 350 meters lies on the y-axis (height) of the scatterplot. Then, find the corresponding x-coordinate (number of floors).
- Estimate the Corresponding Number of Floors
Look for the nearest points in the scatterplot that represent buildings with heights close to 350 meters. Based on their x-coordinates, estimate how many floors those buildings have. For instance, if a building at around 350 meters has an x-coordinate around 75, that gives a strong indication of the estimate.
- Predict the Height for 135 Floors
Next, to find the height of a building with 135 floors, locate where 135 lies on the x-axis (number of floors). Then, find the corresponding y-coordinate (height). Again, look for the points in the scatterplot to get an estimate of the height.
- Average Multiple Points (if Necessary)
If necessary, to increase accuracy, you can average the heights from multiple nearby points to get a better prediction for both scenarios, taking the median value into account for more accuracy.
For a building that is 350 meters tall, the predicted number of floors is approximately 90 floors.
For a building with 135 floors, the predicted height is approximately 525 meters.
More Information
Estimating values based on scatterplots is a common practice in statistics. Here, we use visual analysis to infer relationships between two variables. This method relies on identifying trends from existing data points.
Tips
- Overestimating or Underestimating: When making predictions, it's easy to lean towards the extremes of the scatterplot. Ensure you consider the nearest values for better accuracy.
- Ignoring Scatterplot Trends: Focusing too much on individual points rather than the overall trend can lead to incorrect estimates.
- Assuming Linear Trends: Many scatterplots show roughly linear relationships, but not all. Be cautious of this assumption and check for curves or other patterns.
AI-generated content may contain errors. Please verify critical information